Download
1 / 43
520 likes | 1.16k Views
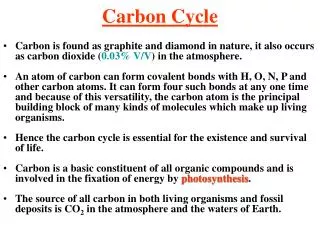
Introduction to Carbon Cycle. • Carbon isotopes have been very heavily utilized to study various aspects of the earth’s carbon cycle. • Extremely diverse applications -Global, regional and local scales -Ocean, atmosphere, terrestrial environments

E N D
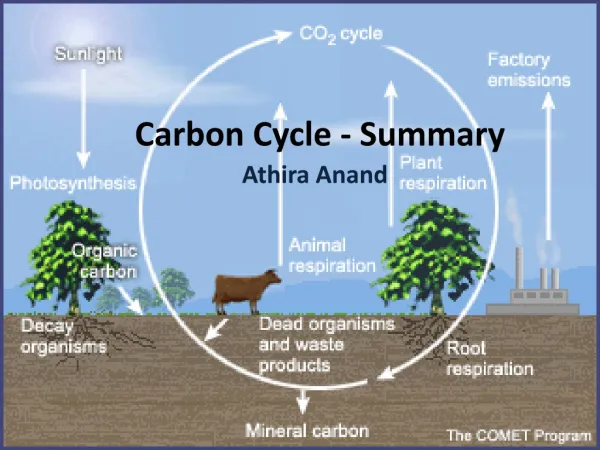
Introduction to Carbon Cycle • Carbon isotopes have been very heavily utilized to study various aspects of the earth’s carbon cycle. • Extremely diverse applications -Global, regional and local scales -Ocean, atmosphere, terrestrial environments -Current, historic, geologic time scales • Mainly focused on the CO2 cycle. -photosynthesis, respiration, carbonate formation/dissolution, air-sea CO2 exchange
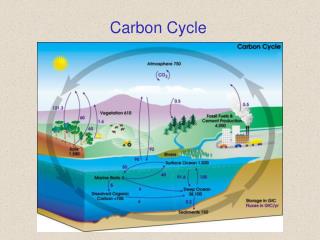
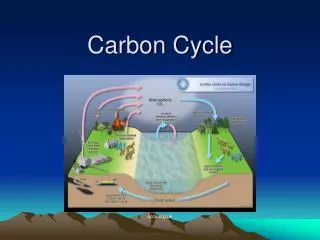
Earth’s Carbon Cycle Pre-anthropogenic C flux in black Anthropogenic C flux in red (1980s) Rocks = 20x106
Size and d13C (vs PDB) of Earth’s Carbon Reservoirs Rocks (carbonate) = 0 ‰ Rocks (organic) -25 ‰ Volcanic CO2 = -5 ‰
Equilibrium Fractionation effects for DIC species (CO2aq, HCO3- and CO3=)
d13C of Fossil Fuels Consumed Globally Natural gas ~ –44 ‰ Oil ~ –27 ‰ Coal ~ –24 ‰ Why has the d13C of fossil fuels been decreasing?
Atmospheric CO2 Budget (1990s) (Gtons or Pg C yr-1) Fossil Fuel Combustion 6.3±0.4 Atmospheric CO2 Accumulation 3.2±0.1 “Missing” CO2 3.1±0.4 Net Ocean Uptake 2.0±0.5 Net Terrestrial Biota Uptake (by difference) 1.1±0.7
Decadal Change in the DIC and d13C in the surface waters of the subtropical N. Pacific C.D. Keeling et al, in GLOBAL BIOGEOCHEMICAL CYCLES, VOL. 18, GB4006, 2004. 10
d13C of Terrestrial Plants C3 = -27±3 ‰ C4 = -13±2 ‰
d13C of Seasonal Atmospheric CO2 Changes d13Closs = -24.8±0.6 ‰ (Pt. Barrow) = -20.3±0.9 ‰ (M. Loa) = -17.5±0.6 ‰ (C. Grim)
Photosynthetic Pathways for C3 and C4 Plants C3 Plants C4 Plants (PEP = Phosphenol Pyruvate)
the bicarbonate ion (HCO3) rather than CO2 reacts with PEP Photosynthetic Pathway for C4 Plants
Fractionation Factors during Photosynthesis α = Klight/Kheavy Sensitivity of αnetto pCO2int
Two Step Photosynthesis Model in a Leaf Step 1 Step 2 CO2(gas) CO2(aq) CO2ext CO2int C6H12O6 Air Outside Inside Stomata Within Leaf
Sensitivity of d13C of C4 plants to pCO2int/pCO2ext d13Cplant=d13CCO2ext – a – (b4+b3*f – a)*pCO2int/pCO2ext
Plant d13C Fractionation Effect(predicted by ecosystem model) e (‰) (Scholze et al., Geo Res Lett, 2003)
Plankton utilization of HCO3rather than CO2 J. Berry in Stable Isotopes in Ecological Research (1989)
Plankton d13C dependence on Growth Rate Growth Rate E
d13C of CO2 Released at Night in Forest d13C of CO2 released (intercept) = -27.6±0.6 ‰ d13C of Amazon trees = -27.6±2 ‰ d13C of Amazon leaves = -30.1±2 o/oo
Correlation between d13C-DIC and Phosphate Photosynthesis in surface layer and respiration below ~200m primarily control PO4 and d13C of DIC.
d13C-Carbonate in Santa Barbara Basin Sediments Spikes of low d13C in carbonate sediments interpreted as methane hydrate release A –3 ‰ decrease implies an addition of CO2 to increase DIC pool by ~5%, which equals ~1800 Pg C (estimate of current reserves is 500-2500 Pg) How does CH4 released wind up in DIC pool? (Kennett et al, 2000)
d13C and Chemical Composition of Organic Matter in Rivers in the Amazon Basin Λ represents the lignin/carbon for organic material. Lignins are produced only by vascular plants. Coarse and fine suspended OM were analyzed. The inset indicates same characteristics for possible source material (leaves, wood, grasses)
Downriver and Discharge Trends in d13C of DIC and OM CPOC is coarse OM and FPOC is fine OM suspended in river
d13C and Air-Sea d13C Disequilibrium Trends d13C disequilibrium = d13Cequil – d13Cmeas’d Observed d13C is more enriched than expected at equilibrium
Calculated Rates of NCP, Supply and Air-Sea CO2 flux The d13C disequilibrium based estimates of NCP and DIC supply indicate that the higher CO2 gas evasion rate at the equator is a result of NCP not keeping up with DIC supply. In contrast, in the subtropics the NCP rate is close to the DIC supply rate which yields a small air-sea CO2 flux.