Download
1 / 19
190 likes | 288 Views
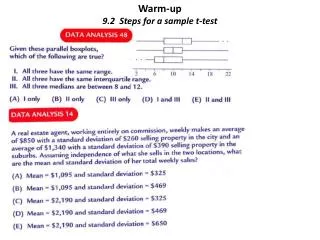
Warm-up 9.2 Steps for a sample t-test. Answers to E#2 – 5 and 10. E2. a. This is an experiment, not sample, so the condition of random Assignment of treatments is met. b. With respective degrees of freedom 5, 5, 5, and 4, the 95% confidence intervals are.

E N D
Answers to E#2 – 5 and 10 E2. a. This is an experiment, not sample, so the condition of random Assignment of treatments is met. b. With respective degrees of freedom 5, 5, 5, and 4, the 95% confidence intervals are C. It looks like there is good evidence to say that the mean of special is smaller than the mean of final. But there is so much overall it is difficult to be completely sure.
E. 3 The sample was random. 10 bottles is probably less than 10% of the water production. The distribution was somewhat symmetric with no outliers. Since 16 ounces is in the 95% confidence interval, it is safe to say that the true average of water is at or near 16 ounces. They should not feel obligated to adjust the machine.
E4. a. A sample of 3 is very small and can not make an approximately normal distribution. The teams were randomly selected. 3 teams is less than 10% of the teams making up the population. c. $3.20, is not in the confidence interval. One possible explanation is because the sample size is too small. d. For a population of 30 a sample size of 10 would be too large.
P5. a. This is not a random sample because all the bags of fries were purchased from the same restaurant. The distribution is only slightly skewed right, so a sample size of 32 is large enough. 32 bags of fries is definitely less than 10% made by McDonald’s. b. Enter the data L1, and do Tinterval of Data. Confidence Interval
C. Since 74 g was in the confidence interval, it is plausible that McDonald’s is meeting its target. 10. D
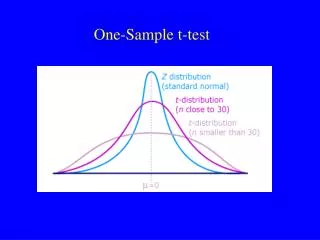
One Sample T-test – Another Example In 1998, as an advertising campaign, the Nabisco Company announced a “1000 chip Challenge,” claiming that every 18 ounce bag of their Chips Ahoy cookies contained at least 1000 chocolate chips. Dedicated Statistics students at the Air Force Academy purchased some randomly selected bags, and counted the chocolate chips. Some of the data are given below. Use an α of 0.05. • 1214 1087 1200 1419 1121 1325 1345 1244 1258 1356 1132 1191 1295 1135 Follow the 4 steps for a significance test. STEP 1: Check conditions and state the test to be conducted.
Chips Ahoy Example Continued… STEP 2: Write out the hypotheses in symbols and words. STEP 3: Calculate the p-value, test statistic and critical value. Draw the t-distribution curve based on the degrees of freedom to show the values. STEP 4: Write a conclusion, describe the p-value and decide whether to reject or fail to reject the null hypothesis
Independent Practice and Notebook Check • Complete the independent practice in the next 25 minutes. • Day 1 of 8.1, 8.2, 9.1 and 9.2 Notebook Check Notes: 1) 8.1, 2) 8.2, 3) 8.2 Errors with Review, 4) 9.1 5) 9.2 4) And 5) are the same handout! 6) 9.2 Day 2 12 pts each 72 pts total (Day 2), 14 terms 2 pts each 28 pts total • Complete H.W. 9.2 E # 20 – 23 and 29 Show all 4 steps for the significance test for #21 and 23. • Bring textbook for textbook review • 2nd Day of Notebook Check next block
Final Exam Project • Last year we investigated whether Ocsa students are in shape. • We collected data for the 3 A.P. Statistics and statistics classes for the Presidential Physical Fitness test. • Some people compared Ocsa’s average for 3 events (push-ups, sit-ups, and v-sit) for males and females to the 50% ile published by the U.S. Government. • Other people did a χ2 test of homogeneity to compare both sets of data. • This year you can choose to investigate the same topic Or investigate another topic. • There will be a data collection day where everyone will do the three events and those with other hypotheses can collect their data.