Download
1 / 17
170 likes | 278 Views
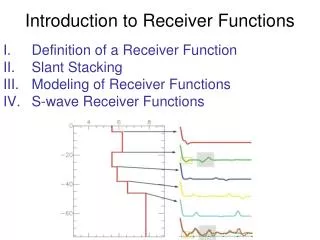
RECEIVER FUNCTIONS analysis for Vs profiles and Moho depth estimations. Andrea Licciardi (1,2) Nicola Piana Agostinetti (1) Geophysics Section, Dublin Institute for Advanced Studies School of Geological Sciences, University College Dublin TABOO Meeting, 23rd – 24th April 2013, Ancona.

E N D
RECEIVER FUNCTIONS analysis for Vs profiles and Moho depth estimations • Andrea Licciardi (1,2) • Nicola Piana Agostinetti (1) • Geophysics Section, Dublin Institute for Advanced Studies • School of Geological Sciences, University College Dublin • TABOO Meeting, 23rd – 24th April 2013, Ancona
RFs data-set Andrea Licciardi Dublin Institute for Advanced Studies Ancona 23rd April 2013
RFs data-set Num. of recorded earthquakes Num. of selected earthquakes Num. of computed RFs Andrea Licciardi Dublin Institute for Advanced Studies Ancona 23rd April 2013
1) RFs: Moho depth. The Zhu and Kanamori (2000) method • Based on a • weighted stack of • RRFs at the predicted arrival times of Ps, PpPs, PpSs+PsPs phases • Grid search in the • H-Vp/Vs domain • For the correct • values of H and Vp/Vs the stacking function is max • RFs are computed • with a frequency domain deconvolution (Di Bona,1998) • Fq ≈ 1 Hz. • Ver. Res ≈ 1 km Andrea Licciardi Dublin Institute for Advanced Studies Ancona 23rd April 2013
1) RFs: Moho depth Andrea Licciardi Dublin Institute for Advanced Studies Ancona 23rd April 2013
1) RFs: Moho depth Piana Agostinetti et al. 2011 Pietralunga Trasimeno Lake Piccione Sigillo Umbertide Promano Andrea Licciardi Dublin Institute for Advanced Studies Ancona 23rd April 2013
2) RFs: mapping the ATF Andrea Licciardi Dublin Institute for Advanced Studies Ancona 23rd April 2013
2) RFs: mapping the ATF Direct P polarity reversal in the very first second of the Radial and Transverse Receiver Functions • DIPPING INTERFACE • HIGH VELOCITY CONTRAST Andrea Licciardi Dublin Institute for Advanced Studies Ancona 23rd April 2013
Evidence of ATF from RFs BAZ BAZ Dist. Dist. • The BAZ of the min amplitude on the RADIAL and of the zero energy on the TRANSVERSE gives the • of the interface DIP-DIRECTION Andrea Licciardi Dublin Institute for Advanced Studies Ancona 23rd April 2013
2) RFs: mapping the ATF ATMC ATMI BAZ BAZ Dist. DIP-DIRECTION Dist. STRIKE AT01 N002 Andrea Licciardi Dublin Institute for Advanced Studies Ancona 23rd April 2013
2) RFs: mapping the ATF AT01 N002 Andrea Licciardi Dublin Institute for Advanced Studies Ancona 23rd April 2013
3) High Frequency RF: comparison with borehole data Freq ~ 1Hz = V-Res: 1km • AT05: same location as Pozzo San Donato • ATVO: Monte Valentino, ~1-2km from Monte Civitello • Focus on Radial RF for isotropic S-vel profile Andrea Licciardi Dublin Institute for Advanced Studies Ancona 23rd April 2013
3) High Frequency RF: comparison with borehole data • Harmonic decomposition of the RF data-set (decoupling of isotropic/anisotropic components) • K=0 analysis (i.e. isotropic) • Max freq. ~ 4Hz , V-res ~ 0.25 km (?) Sharp negative arrival = velocity inversion at depth (within the first 5 km) Andrea Licciardi Dublin Institute for Advanced Studies Ancona 23rd April 2013 Andrea Licciardi Dublin Institute for Advanced Studies Ancona 23rd April 2013
3) High Frequency RF: comparison with borehole data Posterior mean Vp and Vs Fit between mean synthetic and observed RF Maximum probability for an interface at depth 1D Posterior distribution for S-velocity 1D Posterior distribution of seismic interfaces at depth Andrea Licciardi Dublin Institute for Advanced Studies Ancona 23rd April 2013
3) High Frequency RF: comparison with borehole data Interpretation (e.g. Mirabella et al 2011) Litho-discontinuities from Borehole data Vs Discontinuities from RF data (1) (2) (3) (4) (5) (6) (1) ~200m between top Evaporites (2) Intra-Evaporites discontinuities retrieved (3) Top of the Acoustic Basement missed by ~200m, but presence of fine-layering (i.e. Ligurids) on top. Basement is not low Vs as expected (4) Intra-basement discontinuity retrieved (5) No discontinuity between Basement and Evaporites (i.e. Evaporites have low-Vs) (6) Very low-Vs top of the Acoustic Basement Andrea Licciardi Dublin Institute for Advanced Studies Ancona 23rd April 2013
3) High Frequency RF: comparison with borehole data - AT05 0 m Careful inspection of borehole data should be used to interpret the seismic discontinuities retrieved by RF analysis For example, for AT05, the Vs discontinuity at about 3800m might be associated to a sharp resistivity variation ~3030 m (4) ~4483 m “Argilloscisti” sequence
CONCLUSIONS Results from RFs analysis show a complex Moho topography in between the Tyrrhenian and Adriatic domains; RFs can be used to map faults with high velocity contrast in the shallow crust; Velocitity profiles from high frequency RFs can be directly compared with borehole data providing additional information for geological interpretations; OUTLOOK: Results from station ATVO will be compared with the available data from Monte Civitello borehole; 1D Vs velocity profiles will be computed at each station. Andrea Licciardi Dublin Institute for Advanced Studies Ancona 23rd April 2013