Download
1 / 1
10 likes | 108 Views
Detection of A2-P2 Interval using S-Transform and Gaussian Modeling Eyal Balla 1 , Guy Amit 1 , Noam Gavriely 2 , Nathan Intrator 1 1 School of Computer Science, Tel-Aviv University 2 Rappaport Faculty of Medicine, Technion. Abstract. Methods – Cont. Results. Conclusion.

E N D
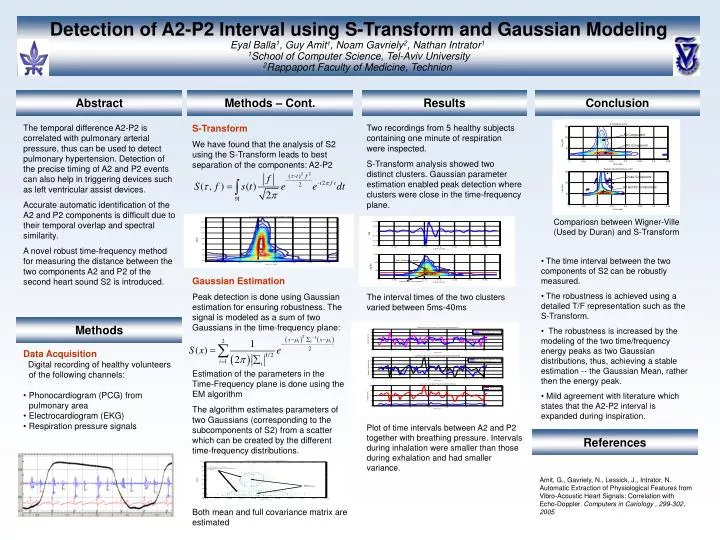
Detection of A2-P2 Interval using S-Transform and Gaussian Modeling Eyal Balla1, Guy Amit1, Noam Gavriely2, Nathan Intrator1 1School of Computer Science, Tel-Aviv University2Rappaport Faculty of Medicine, Technion Abstract Methods – Cont. Results Conclusion The temporal difference A2-P2 is correlated with pulmonary arterial pressure, thus can be used to detect pulmonary hypertension. Detection of the precise timing of A2 and P2 events can also help in triggering devices such as left ventricular assist devices. Accurate automatic identification of the A2 and P2 components is difficult due to their temporal overlap and spectral similarity. A novel robust time-frequency method for measuring the distance between the two components A2 and P2 of the second heart sound S2 is introduced. S-Transform We have found that the analysis of S2 using the S-Transform leads to best separation of the components: A2-P2 Gaussian Estimation Peak detection is done using Gaussian estimation for ensuring robustness. The signal is modeled as a sum of two Gaussians in the time-frequency plane: Estimation of the parameters in the Time-Frequency plane is done using the EM algorithm The algorithm estimates parameters of two Gaussians (corresponding to the subcomponents of S2) from a scatter which can be created by the different time-frequency distributions. Both mean and full covariance matrix are estimated Two recordings from 5 healthy subjects containing one minute of respiration were inspected. S-Transform analysis showed two distinct clusters. Gaussian parameter estimation enabled peak detection where clusters were close in the time-frequency plane. The interval times of the two clusters varied between 5ms-40ms Plot of time intervals between A2 and P2 together with breathing pressure. Intervals during inhalation were smaller than those during exhalation and had smaller variance. Compariosn between Wigner-Ville (Used by Duran) and S-Transform • The time interval between the two components of S2 can be robustly measured. • The robustness is achieved using a detailed T/F representation such as the S-Transform. • The robustness is increased by the modeling of the two time/frequency energy peaks as two Gaussian distributions, thus, achieving a stable estimation -- the Gaussian Mean, rather then the energy peak. • Mild agreement with literature which states that the A2-P2 interval is expanded during inspiration. Methods • Data Acquisition • Digital recording of healthy volunteers of the following channels: • Phonocardiogram (PCG) from pulmonary area • Electrocardiogram (EKG) • Respiration pressure signals References Amit, G., Gavriely, N., Lessick, J., Intrator, N. Automatic Extraction of Physiological Features from Vibro-Acoustic Heart Signals: Correlation with Echo-Doppler. Computers in Cariology , 299-302, 2005