Download
1 / 5
50 likes | 57 Views
In this paper we have detected and analyzed sag and swell type of disturbance in power signal using fractional fourier transform method. Each signal is analyzed for different values of transform order in the range of 0 to 1. We have analyzed this algorithm in MATLAB simulation tool. This analysis is performed to find out the performance of this method on different types of disturbances. We have analyzed this to find out maximum deviation in each disturbance and compare it for each signal. Mithilesh Kumar Thakur | Dr. Tanuj Manglani "Detection and Analysis of Sag and Swell Power Quality Disturbances using Fractional Fourier Transform" Published in International Journal of Trend in Scientific Research and Development (ijtsrd), ISSN: 2456-6470, Volume-2 | Issue-4 , June 2018, URL: https://www.ijtsrd.com/papers/ijtsrd14204.pdf Paper URL: http://www.ijtsrd.com/engineering/electrical-engineering/14204/detection-and-analysis-of-sag-and-swell-power-quality-disturbances-using-fractional-fourier-transform/mithilesh-kumar-thakur<br>

E N D
International Research Research and Development (IJTSRD) International Open Access Journal International Open Access Journal International Journal of Trend in Scientific Scientific (IJTSRD) ISSN No: 2456 - 6470 | www.ijtsrd.com | Volume Detection and Analysis of Sag and Swell Power Quality Disturbances Detection and Analysis of Sag and Swell Power Quality Disturbances ISSN No: 2456 www.ijtsrd.com | Volume - 2 | Issue – 4 Detection and Analysis of Sag and Swell Power Quality Disturbances using Fractional Fourier Transform using Fractional Fourier Transform Mithilesh Kumar Thakur Mithilesh Kumar Thakur1, Dr. Tanuj Manglani2 1P. G. Scholar, 2Professor Yagyavalkya Institute of Technology, Jaipur, Rajasthan, India Yagyavalkya Institute of Technology, Jaipur, Rajasthan, India Department of Electrical, Yagyavalkya Institute of Technology, Jaipur, Rajasthan, India sufficient enough to analyze and detect the power quality disturbances. ABSTRACT In this paper we have detected and analyzed sag and swell type of disturbance in power signal using fractional fourier transform method. Each signal is analyzed for different values of transform order in the range of 0 to 1. We have analyzed this algorithm MATLAB simulation tool. This analysis is performed to find out the performance of this method on different types of disturbances. We have analyzed this to find out maximum deviation in each disturbance and compare it for each signal. sufficient enough to analyze and detect the power In this paper we have detected and analyzed sag and swell type of disturbance in power signal using fractional fourier transform method. Each signal is analyzed for different values of transform order in the range of 0 to 1. We have analyzed this algorithm in MATLAB simulation tool. This analysis is performed to find out the performance of this method on different types of disturbances. We have analyzed this to find out maximum deviation in each disturbance Quality of electric power is generally degraded due to the occurrence of disturbances like voltage sag, swell, transients, interruption, harmonics and flicker. These disturbances cause malfunctioning of circuit breaker, user instrument and decay the performance of transmission tection of the disturbances and its source is important to install a mitigation device for enhancing the power quality. Most of the typical power analyzers do not provide enough temporal information of the disturbances. Therefore, the monitoring device uld be capable to identify and classify the power . The signal processing methods frequently implemented for parameter extraction include fast Fourier transform (FFT), S-transform (ST), Wavelet transform (WT), empirical mode on (EMD) and Kalman filter. The parameters are then used as input to a classifier such ficial neural network (ANN), rule base, fuzzy logic (FL), and support vector machine (SVM). Various methods have been presented with different combinations of signal processing methods and classifiers to improve the fication. The estimation coefficients of the WT are not unique and consist of information of a band of frequencies in combination with the Quality of electric power is generally degraded due to the occurrence of disturbances like voltage sag, swell, transients, interruption, harmonics and disturbances cause malfunctioning of circuit breaker, failure of end-user instrument and decay the performance of transmission Detection of the disturbances and its source is important to install a mitigation device for enhancing the power quality. Most of the typical power analyzers do not provide enough temporal information of the disturbances. Therefore, the monitoring device should be capable to identify and classify the power quality disturbances. The signal processing methods frequently implemented for parameter extraction include fast Fourier transform (FFT), S (ST), Wavelet transform (WT), empirical mode decomposition (EMD) and Kalman parameters are then used as input to a classi as expert system, artificial neural network (ANN), rule base, fuzzy logic (FL), and support vector machine (SVM). Various methods have been presented with different combina processing methods and classi accuracy of classification. The estimation coefficients of the WT are not unique and consist of information of a band of frequencies in combination with the fundamental frequency. system system devices. devices. Keywords: Sag, Swell, Power Quality, Fractional Fourier Transform, Disturbances uality, Fractional 1. INTRODUCTION The existence of power quality disturbances during electricity production from the electronics tools plays an important role among the electrical power production center and customer usage. These disturbances are required to observe each time for betterment of the power quality signal produced from the electronics tool. Several types of disturbances included in the system are voltage outage, voltage transient, voltage swell, voltage swing, voltage flicker and harmonics. The existence of power quality disturbances during electricity production from the electronics tools plays an important role among the electrical power production center and customer usage. These ances are required to observe each time for betterment of the power quality signal produced from the electronics tool. Several types of disturbances included in the system are voltage outage, voltage transient, voltage swell, voltage swing, voltage flicker Before some years, Fourier transform was used as detection tool to distinguish the disturbance occurred in the power signals, but it has some restriction and disadvantage as it is implemented on only stationary signal and cannot implement in non-stationary signal. As these disturbances come into the category of non stationary signal and Fourier transform is not much Before some years, Fourier transform was used as detection tool to distinguish the disturbance occurred in the power signals, but it has some restriction and disadvantage as it is implemented on only stationary stationary signal. Power quality (PQ) has turned into a big concern in the current years with the growing utilization of non linear loads, power electronics based instruments etc. linear loads, power electronics based instruments etc. (PQ) has turned into a big concern in the current years with the growing utilization of non- As these disturbances come into the category of non- stationary signal and Fourier transform is not much @ IJTSRD | Available Online @ www.ijtsrd.com @ IJTSRD | Available Online @ www.ijtsrd.com | Volume – 2 | Issue – 4 | May-Jun 2018 Jun 2018 Page: 1067
International Journal of Trend in Scientific Research and Development (IJTSRD) ISSN: 2456 nal Journal of Trend in Scientific Research and Development (IJTSRD) ISSN: 2456 nal Journal of Trend in Scientific Research and Development (IJTSRD) ISSN: 2456-6470 Power quality concerns utility and consumers similarly. Poor power quality provides results such as; breakdowns, instability, shortened life of the instrument etc. Power quality disturbances such as; voltage sag, voltage swell, momentary interruption, notches, glitches, harmonic distortions, transients etc. have become normal in present power system. The sources and reasons of such disturbances must be known in order to enhance the quality of the electric power. These power quality disturbances are non stationary in nature and happen for short duration. IEEE 1159-2009 describes these disturbances in terms of their magnitude, frequency content, and duration. r magnitude, frequency content, and duration. Power quality concerns utility and consumers similarly. Poor power quality provides results such as; wns, instability, shortened life of the instrument etc. Power quality disturbances such as; voltage sag, voltage swell, momentary interruption, notches, glitches, harmonic distortions, transients etc. have become normal in present power system. The and reasons of such disturbances must be known in order to enhance the quality of the electric power. These power quality disturbances are non- stationary in nature and happen for short duration. 2009 describes these disturbances in terms Different signal processing techniques are applied for the analysis of these signals. Among them, Fourier transform provides representation while the time data gets void. Therefore, Fourier transform is not enough for the detection of these signals. The windowed version of Fourier transform also called short time Fourier transform (STFT) is the advanced version of the Fourier transform which disadvantages of the Fourier transform but it still have a disadvantage of time-frequency resolution based on the constant window width. Wavelet transform on the other hand can extract frequency and time data altogether, which makes it appropriate for the detection of non-stationary signals. quality (PQ) is necessary for robust functioning of power systems. Major reasons of power quality degradation involve faults, capacitor switching, load switching, solid state switching instruments, arc furnaces, power converters, transformers. These features increase the chances of power quality disturbances (PQDs) like sag, swell, transient, harmonics, notch, interruption, spikes. Different signal processing techniques are applied for the analysis of these signals. Among them, Fourier transform provides representation while the time data gets void. transform is not enough for the detection of these signals. The windowed version of Fourier transform also called short time Fourier transform (STFT) is the advanced version of the Fourier transform which amplitude amplitude frequency frequency Fig-1: Voltage s age sag signal A swell is opposite of sag, defined by increase quare of voltage or current between 1.1 and 1.8 for a duration of ½ cycles to 60 seconds. These are mostly connected with system disturbance conditions, but they are not very similar like Sags. Fig Swell: A swell is opposite of sag, defined by increase in root mean square of voltage or current between 1.1 and 1.8 for a duration of ½ cycles to 60 seconds. These are mostly connected with system disturbance conditions, but they are not very similar 2 represents a voltage swell in a represents a voltage swell in a voltage signal. eliminates eliminates orm but it still have some some frequency resolution based on the constant window width. Wavelet transform on the other hand can extract frequency and time data altogether, which makes it appropriate for the Good power quality (PQ) is necessary for robust functioning of power systems. Major reasons of power quality degradation involve faults, capacitor switching, load switching, solid state switching instruments, arc furnaces, power converters, transformers. These features increase the chances of power quality disturbances (PQDs) like sag, swell, and and energised energised interruption, flicker and Fig-2: Voltage swell well signal 2.POWER QUALITY DISTURBANCES Sag: It is a reduction in RMS voltage or currents to about 0.1 to 0.9 volt or ampere at normal supply frequency for a time span of ½ cycles to 60 seconds. Voltage sags are generally connected wit disturbances but can also be generated by connection of heavy loads or beginning of large motors. Fig represents a voltage sag in a voltage signal. POWER QUALITY DISTURBANCES A transient is a signal having a disturbance that diminishes to zero in a finite time. Transients can be again splitted as impulsive transients and oscillatory transients. Impulsive transients are unexpected, non-power frequency state condition of power signal that is usually unidirectional in polarity whereas oscillatory transients are unexpected frequency variation in the steady state condition of the power signal and this usually exhibits both positive and negative polarity values. Fig 3 represents a transient Transient: A transient is a signal having a disturbance that diminishes to zero in a finite time. Transients can be again splitted as impulsive transients and oscillatory transients. Impulsive transients are unexpected, non variation in the steady-state condition of power signal that is usually unidirectional in polarity whereas oscillatory transients are unexpected frequency variation in the steady state condition of the power signal and this usually exhibits both posi negative polarity values. Fig disturbance signal. It is a reduction in RMS voltage or currents to about 0.1 to 0.9 volt or ampere at normal supply frequency for a time span of ½ cycles to 60 seconds. Voltage sags are generally connected with system disturbances but can also be generated by connection of large motors. Fig 1 signal. @ IJTSRD | Available Online @ www.ijtsrd.com @ IJTSRD | Available Online @ www.ijtsrd.com | Volume – 2 | Issue – 4 | May-Jun 2018 Jun 2018 Page: 1068
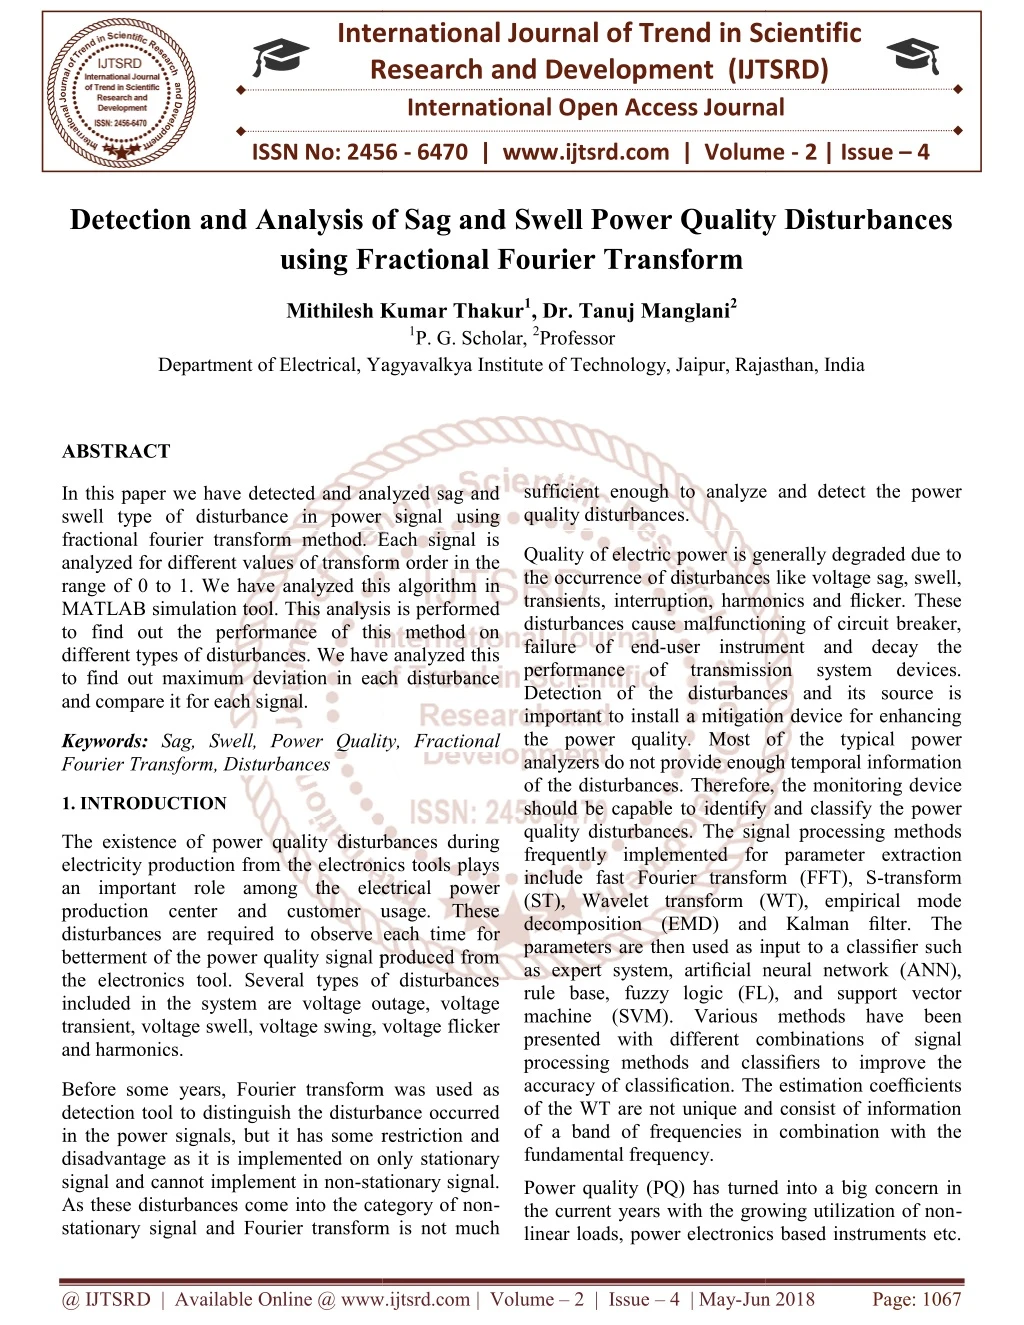
International Journal of Trend in Scientific Research and Development (IJTSRD) ISSN: 2456 nal Journal of Trend in Scientific Research and Development (IJTSRD) ISSN: 2456 nal Journal of Trend in Scientific Research and Development (IJTSRD) ISSN: 2456-6470 Fig-5 Voltage harmonics signa 5 Voltage harmonics signal Fig-3 Voltage transient signal signal Flicker: Voltage variations are series of random voltage modifications or spikes. Flicker is described by its RMS magnitude denoted as a pe fundamental frequency magnitude. Their magnitude usually will be in the range of 0.9 to 1 .1 volt or ampere. The main source of voltage variations are the continuous rapid changes of load. Arc furnace is one of the common reason for voltage fl represents the voltage flickers in a signal. represents the voltage flickers in a signal. Voltage variations are series of random voltage modifications or spikes. Flicker is described by its RMS magnitude denoted as a percent of the fundamental frequency magnitude. Their magnitude usually will be in the range of 0.9 to 1 .1 volt or ampere. The main source of voltage variations are the continuous rapid changes of load. Arc furnace is one for voltage flickers. Fig 4 3.FRACTIONAL FOURIER TRANSFORM FRACTIONAL FOURIER TRANSFORM Fractional Fourier transform (FRFT) is a simple form of Fourier transform (FT). It has been demonstrated to be one of the most important equipment in non- stationary signal processing methods. There has been the significant topics connected with Fractional Fourier Transform. One of the benefits for the FRFT differentiated with the FT is Fractional Fourier transform (FRFT) is a simple form of Fourier transform (FT). It has been demonstrated to be one of the most important equipment in non stationary signal processing methods. There has been a vast research on the signi with Fractional Fourier Transform. One of the benefits for the FRFT differentiated with the FT is that the signal which is non-band limited in the fourier transform domain may be band limited in the fractional Fourier domain (FRFD). Sampling theorem is an important problem in signal processing. In the sampling mechanism, the sampling rate must fulfill the Nyquist sampling rate, otherwise the spectrum aliasing will happen and influence the performance of the signal recovery and estimation uniform sampling usually occurs in practical applications. The signal recovery and spectral analysis from non-uniform sampling sequence in the fractional fourier transform have been r years. FRFT of p order is expressed expressed as: band limited in the fourier transform domain may be band limited in the n (FRFD). Sampling theorem is an important problem in signal processing. In the sampling mechanism, the sampling rate must fulfill the Nyquist sampling rate, otherwise the spectrum aliasing will happen and influence the performance of nd estimation. However, non- uniform sampling usually occurs in practical applications. The signal recovery and spectral analysis uniform sampling sequence in the fractional fourier transform have been researched in recent ∞ Fig-4 Voltage flicker signal 4 Voltage flicker signal ( )??(?,?)?? ??(?) = ? ?(?) ?∞ Harmonics: Harmonics can be described as sinusoidal waveforms having frequencies that are multiples of the frequency at which the supply voltage is intended to be delivered. It is usually generated due to the non-linear features of the load and tools. A parameter utilized to calculate the harmonics is the Total Harmonic Distortion (THD). Fig. voltage signal with harmonics. Harmonics can be described as sinusoidal waveforms having frequencies that are multiples of the frequency at which the supply voltage ivered. It is usually generated due linear features of the load and tools. A parameter utilized to calculate the harmonics is the stortion (THD). Fig. 5 represents a Where, Kp(t, u) is kernel function, which is defined as: (t, u) is kernel function, which is defined 4.EXPERIMENTAL RESULTS EXPERIMENTAL RESULTS In the proposed research we have taken the signal of duration 0.5 second and sampled with sampling frequency of 6.4 KHz and signal frequency of 50 Therefore the time period of signal is 0.02 second, number of cycle is 25, total number of samples per cycle is 128 and total sampling points is 3200. Our main objective is to analyze the main objective is to analyze the sag and swell we have taken the signal of duration 0.5 second and sampled with sampling and signal frequency of 50 Hz. re the time period of signal is 0.02 second, number of cycle is 25, total number of samples per cycle is 128 and total sampling points is 3200. Our @ IJTSRD | Available Online @ www.ijtsrd.com @ IJTSRD | Available Online @ www.ijtsrd.com | Volume – 2 | Issue – 4 | May-Jun 2018 Jun 2018 Page: 1069
International Journal of Trend in Scientific Research and Development (IJTSRD) ISSN: 2456-6470 0 500 1000 1500 2000 2500 3000 3500 Absolute value of FRFT of Original signal with transform order a=0.05 disturbed signals based on fractional Fourier transform and simulate its results with the results of Fourier transform. All the simulations have been performed in MATLAB tool. Each disturbed signal is analyzed for different values of transform order. 2 1 0 0 500 1000 1500 2000 2500 3000 3500 Absolute value of FRFT of swell signal with transform order a=0.05 2 1 Absolute value of FRFT of Original signal with transform order a=0.05 0 2 0 500 1000 1500 2000 2500 3000 3500 1 Difference between FRFTed signal and FRFTed swell signal with transform order a=0.05 1 0 0 500 1000 1500 2000 2500 3000 3500 0.5 Absolute value of FRFT of sag signal with transform order a=0.05 0 2 0 500 1000 1500 2000 2500 3000 3500 1 0 0 500 1000 1500 2000 2500 3000 3500 Absolute value of FRFT of Original signal with transform order a=0.1 2 Difference between FRFTed signal and FRFTed sag signal with transform order a=0.05 1 1 0.5 0 0 0 500 1000 1500 2000 2500 3000 3500 0 500 1000 1500 2000 2500 3000 3500 Absolute value of FRFT of swell signal with transform order a=0.1 2 Absolute value of FRFT of Original signal with transform order a=0.1 1 2 1 0 0 500 1000 1500 2000 2500 3000 3500 0 0 500 1000 1500 2000 2500 3000 3500 Difference between FRFTed signal and FRFTed swell signal with transform order a=0.1 1 Absolute value of FRFT of sag signal with transform order a=0.1 2 0.5 1 0 0 0 500 1000 1500 2000 2500 3000 3500 0 500 1000 1500 2000 2500 3000 3500 Difference between FRFTed signal and FRFTed sag signal with transform order a=0.1 Absolute value of FRFT of Original signal with transform order a=0.15 1 2 0.5 0 1 0 500 1000 1500 2000 2500 3000 3500 0 Absolute value of FRFT of Original signal with transform order a=0.15 0 500 1000 1500 2000 2500 3000 3500 2 Absolute value of FRFT of swell signal with transform order a=0.15 2 1 0 1 0 500 1000 1500 2000 2500 3000 3500 Absolute value of FRFT of sag signal with transform order a=0.15 0 2 0 500 1000 1500 2000 2500 3000 3500 1 Difference between FRFTed signal and FRFTed swell signal with transform order a=0.15 1 0 0 500 1000 1500 2000 2500 3000 3500 Difference between FRFTed signal and FRFTed sag signal with transform order a=0.15 0.5 1 0.5 0 0 500 1000 1500 2000 2500 3000 3500 0 0 500 1000 1500 2000 2500 3000 3500 Fig-7 FRFT analysis of voltage swell signal Fig-6 FRFT analysis of voltage sag signal This is the process of detecting and analysing sag and swell type of disturbances in voltage signal using fractional fourier transform method. In this case we have taken all the parameters correct. We have calculated and compared maximum deviation of these signals based on different values of transform order which is shown in table below. Similarly these sag signal and swell signal are analyzed for different values of transform order in the range of 0 to 1. @ IJTSRD | Available Online @ www.ijtsrd.com | Volume – 2 | Issue – 4 | May-Jun 2018 Page: 1070
International Journal of Trend in Scientific Research and Development (IJTSRD) ISSN: 2456-6470 Table 1: Maximum deviation in disturbed signals 6. CONCLUSIONS In this paper we have proposed a new method based on Fractional Fourier transform (FRFT) to detect and analyze the power quality disturbances from the power quality signal. We have considered sag and swell disturbed signals in this paper. We will detect and analyze some more disturbances using fractional fourier transform in our future work. REFERENCES 1)IEEE Recommended Practice for Monitoring Electric Power Quality, IEEE Std. 1159-2009, 2009. Transform order Sag Swell 0.7459 0.5949 0.05 0.7428 0.3943 0.1 0.7267 0.3802 0.15 0.7449 0.3909 0.2 0.8180 0.3726 0.25 0.7294 0.3826 0.3 2)J. Milanovic, J. Meyer, R. Ball, and et al, “International Industry Practice on Power-Quality monitoring,” IEEE Trans. Power Del., vol. 29, no. 2, pp. 934–941, 2014. 0.6368 0.3662 0.35 0.5611 0.3609 0.4 3)M. Kezunovic and Y. Liao, “A Novel Software Implementation Concept for Power Quality Study,” IEEE Trans. Power Del., vol. 17, no. 2, pp. 544–549, 2002. 0.5056 0.3891 0.45 0.5781 0.3974 0.5 4)M. Uyar, S. Yildirim, and M. T. Gencoglu, “An effective wavelet-based feature extraction method for classification of power quality disturbance signals,” Elect. Power Syst. Res., vol. 78, no. 10, pp. 1747–1755, 2008. 0.5772 0.4245 0.55 0.6366 0.4290 0.6 0.6179 0.4344 0.65 5)S. Shukla, S. Mishra, and B. Singh, “Empirical- Mode Decomposition With Hilbert Transform for Power-Quality Assessment,” IEEE Trans. Power Del., vol. 24, no. 4, pp. 2159–2165, 2009. 0.5867 0.4415 0.7 0.5671 0.4383 0.75 6)C.-Y. Lee and Y.-X. Shen, “Optimal Feature Selection for Power-Quality Classification,” IEEE Trans. Power Del., vol. 26, no. 4, pp. 2342–2351, 2011. Disturbances 0.5703 0.4386 0.8 0.5966 0.4454 0.85 7)M. Zhang, K. Li, and Y. Hu, “A real-time classification method disturbances,” Elect. Power Syst. Res., vol. 81, no. 2, pp. 660– 666, 2011. 0.5941 0.4412 0.9 of power quality 0.6009 0.4376 0.95 8)M. Biswal and P. K. Dash, “Detection and characterization of multiple power quality disturbances with a fast S-transform and decision tree based classifier,” Digital Signal Processing, vol. 23, no. 4, pp. 1071– 1083, 2013. 0.6078 0.4400 1.0 @ IJTSRD | Available Online @ www.ijtsrd.com | Volume – 2 | Issue – 4 | May-Jun 2018 Page: 1071