Download
1 / 1
10 likes | 116 Views
1 Beaudoin N., 1 Mary B., 2 Laurent F., 2 Aubrion G. , 1 Saad J. INRA Environnement et Agronomie 1 Laon; 2 Arvalis (France). Is N. balance a good indicator of N losses in arable systems?. Introduction.

E N D
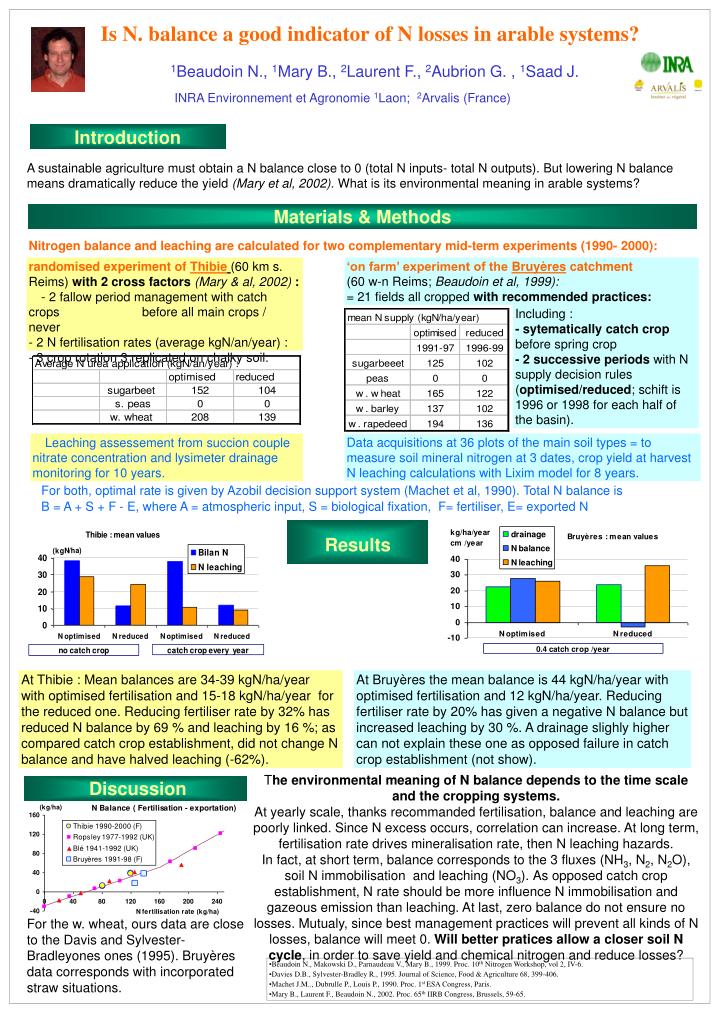
1Beaudoin N., 1Mary B., 2Laurent F., 2Aubrion G. , 1Saad J. INRA Environnement et Agronomie 1Laon; 2Arvalis (France) Is N. balance a good indicator of N losses in arable systems? Introduction A sustainable agriculture must obtain a N balance close to 0 (total N inputs- total N outputs). But lowering N balance means dramatically reduce the yield (Mary et al, 2002).What is its environmental meaning in arable systems? Materials & Methods Nitrogen balance and leaching are calculated for two complementary mid-term experiments (1990- 2000): randomised experiment of Thibie(60 km s. Reims)with 2 cross factors (Mary & al, 2002) : • - 2 fallow period management with catch crops before all main crops / never • - 2 N fertilisation rates (average kgN/an/year) : • - 3 crop rotation 3 replicated on chalky soil. ‘on farm’ experiment of the Bruyères catchment (60 w-n Reims; Beaudoin et al, 1999): = 21 fields all cropped with recommended practices: Including : - sytematically catch crop before spring crop - 2 successive periods with N supply decision rules(optimised/reduced; schift is 1996 or 1998 for each half of the basin). • Leaching assessement from succion couple nitrate concentration and lysimeter drainage monitoring for 10 years. Data acquisitions at 36 plots of the main soil types = to measure soil mineral nitrogen at 3 dates, crop yield at harvest N leaching calculations with Lixim model for 8 years. • For both, optimal rate is given by Azobil decision support system (Machet et al, 1990). Total N balance is • B = A + S + F - E, where A = atmospheric input, S = biological fixation, F= fertiliser, E= exported N Results At Thibie : Mean balances are 34-39 kgN/ha/year with optimised fertilisation and 15-18 kgN/ha/year for the reduced one. Reducing fertiliser rate by 32% has reduced N balance by 69 % and leaching by 16 %; as compared catch crop establishment, did not change N balance and have halved leaching (-62%). At Bruyères the mean balance is 44 kgN/ha/year with optimised fertilisation and 12 kgN/ha/year. Reducing fertiliser rate by 20% has given a negative N balance but increased leaching by 30 %. A drainage slighly higher can not explain these one as opposed failure in catch crop establishment (not show). The environmental meaning of N balance depends to the time scale and the cropping systems. At yearly scale, thanks recommanded fertilisation, balance and leaching are poorly linked. Since N excess occurs, correlation can increase. At long term, fertilisation rate drives mineralisation rate, then N leaching hazards. In fact, at short term, balance corresponds to the 3 fluxes (NH3, N2, N2O), soil N immobilisation and leaching (NO3).As opposed catch crop establishment, N rate should be more influence N immobilisation and gazeous emission than leaching. At last, zero balance do not ensure no losses. Mutualy, since best management practices will prevent all kinds of N losses, balance will meet 0. Will better pratices allow a closer soil N cycle, in order to save yield and chemical nitrogen and reduce losses? Discussion For the w. wheat, ours data are close to the Davis and Sylvester-Bradleyones ones (1995). Bruyères data corresponds with incorporated straw situations. • Beaudoin N., Makowski D., Parnaudeau V., Mary B., 1999. Proc. 10th Nitrogen Workshop, vol 2, IV-6. • Davies D.B., Sylvester-Bradley R., 1995. Journal of Science, Food & Agriculture 68, 399-406. • Machet J.M.., Dubrulle P., Louis P., 1990. Proc. 1st ESA Congress, Paris. • Mary B., Laurent F., Beaudoin N., 2002. Proc. 65th IIRB Congress, Brussels, 59-65.