Download
1 / 26
260 likes | 396 Views
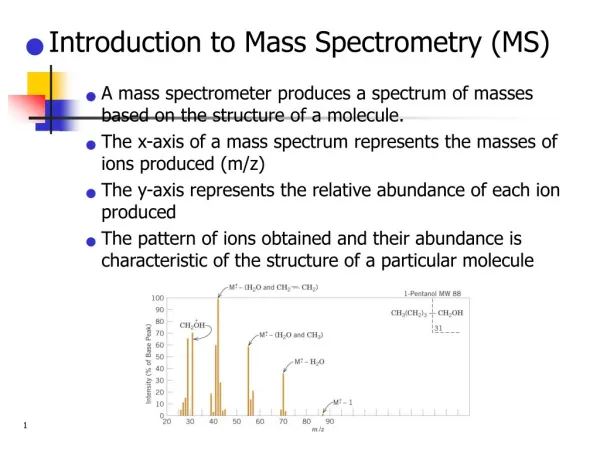
GeneSpring MS GeneSpring for BioMarker Analysis using Mass Spectrometry data. Definition of a Biomarkers.

E N D
GeneSpring MSGeneSpring for BioMarker Analysis using Mass Spectrometry data
Definition of a Biomarkers • Used to indicate or measure a biological process (for instance, levels of a specific protein in blood or spinal fluid, genetic mutations, or brain abnormalities observed in a PET scan or other imaging test). Detecting biomarkers specific to a disease can aid in the identification, diagnosis, and treatment of affected individuals and people who may be at risk but do not yet exhibit symptoms.www.alz.org/Resources/Glossary.asp • Any molecular species found to provide correlation to a particular phenotype or perturbation of a biological system. Co-variant analysis of multiple biomarkers or patterns usually results in higher correlation confidence.www.inproteomics.com/nwglosbc.html • A molecular marker associated with a biological function.www.genpromag.com/Glossary~LETTER~B.html
Agilent Proteomics Biomarker Profiling Workflow SAMPLE1 DATA Candidate Biomarker Identification SAMPLE2 Extraction 6510 QTOF Candidates Depletion Fractionation Proteolytic Digest Extraction 6410 QQQ Identification Validation
GeneSpring MS – GeneSpring for Mass Spectrometry and Biomarker analysis • Allows the easy import, storage and visualization of LC/MS(/MS) and GC/MS data for many samples and exp. Designs • Will support the complete proteomics/metabolomics workflow (Discovery – Identification – Validation) • Identify significantly different protein- and metabolite-abundances across experimental conditions without the need to be a statistical expert
GeneSpring MS for Biomarker discoveryBuilt on the Agilent GeneSpring Platform
Typical Biomarker Lifecycle BioMarker identification Biomarker validation Biomarker Discovery
Typical Biomarker Lifecycle GeneSpring MS 1.0 Agilent LC/MS TOF (6210) Agilent QTOF (6510) (MS1 mode) Any vendors’ GC/MS SELDI/MALDI TOF (GS MS 2.0) GeneSpring MS 2.0 (Q2 FY07) Agilent QTOF (6510) (MS^n) Other vendors (mzData) GeneSpring MS 2.0 (Q2 FY07) Agilent QQQ (6410) Other Vendors (mzData) BioMarker identification Biomarker validation Biomarker Discovery
Applications of GeneSpring MS • Find Protein Biomarkers for disease diagnosis • Find Metabolite Biomarkers for drug toxicity screening • Monitor the drug production plant’s efficiency • Classify unknown patient samples for disease outcome prediction
GeneSpring MS • GeneSpring MS is designed to serve the Proteomics and Metabolomics needs of our customers • Proteomics/Metabolomics pillar of the GeneSpring Platform
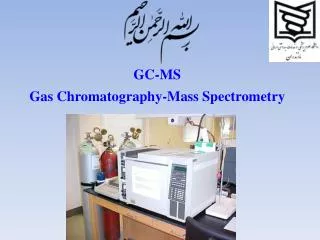
Sample Preparation GC/MS Analysis LC/MS Analysis Peak Finding Data normalization Statistical Analysis System Biology Analysis Metabolomics Workflow - Overview Metabolite Identification Needed for Understanding • Purpose: • extract and sub-fractionate metabolites from sample • Typical samples: • Body fluids • Tissue • Plants Purpose: Separate and detect metabolites by the appropriate tool Purpose: Find and quantitate all metabolites Purpose: Correct data for retention time and response drift Purpose: Find meaningful differences in sample sets Purpose: Understand the biological meaning of the data
TOF LC/MS Workflow #1: Load Agilent MHD files .WIFF files MHD Files GeneSpring MS Mass Hunter Mol Feat Extr Identify diff. expressed Biomarkers Using statistics Optional if identification of proteins is required Spectrum Mill PMF Search Update annotations In GeneSpring MS List of identified masses List of interesting mass values 510.546 = BRCA1 786.562 = BRCA1 1575.897 = NP_45687 1945.78 = ? . 510.546, pI=4 786.562, pI=8 1575.897, pI=3 1945.78, pI=4 . Plug-in Sent to SM
TOF LC/MS Workflow #1: Load Agilent MHD files .WIFF files MHD Files GeneSpring MS Mass Hunter Mol Feat Extr Identify diff. expressed Biomarkers Using statistics Link to Metlin Etc. for Structure search List of interesting mass values 510.546, pI=4 786.562, pI=8 1575.897, pI=3 1945.78, pI=4 .
TOF LC/MS Workflow #2: TOF-QTOF, ID before loaded in GSMS .WIFF files MHD Files GeneSpring MS Mass Hunter Mol Feat Extr Identify diff. expressed Biomarkers Using statistics Annotate peaks In GeneSpring MS MS/MS data files Spectrum Mill MS/MS Search MS/MS run (QTOF w same LC setup) List of interesting mass values (+ RT) Create Inclusion list file 510.546 786.562 1575.897 1945.78 . Re-run Samples on MS/MS (Ion Trap?) Picking just the Interesting peaks for MS/MS
Workflow # 4: GC/MS analysis of metabolites AMDIS DB search (NIST) ELU/FIN files Unid/Identified masses GC/MS GeneSpring MS Identify diff. expressed Biomarkers Using statistics List of interesting mass values 510.546 786.562 1575.897 1945.78 .
GeneSpring MS allows you to…Load data from a variety of MS systems • Load data from Agilent LC/MS (Q)TOF system (MHD files) • Load data from Agilent GC/MS system (ELU/FIN files from AMDIS • Load data from Agilent QQQ (Quant Result Files) (In 2.0) • Load data in a generic CSV/TDF format (In 2.0) • Load data in mzData/mzXML format from LC/MS/MS systems (in 2.0)
GeneSpring MS allows you to…Compare mass features across different runs • Each mass feature is represented as an entity with the following properties • RT; Retention time, or RI, retention index (normalized RT) • Mass; neutral mass
GeneSpring MS allows you to…Compare mass features across different runs • Mass features are “aligned” from one run to the next based on the similarity between the RT/mass values • For GC/MS data fragmentation spectra are used for alignment
GeneSpring MS allows you to…Find statistically significant differences in abundance • Abundance of the metabolites or peptides can be compared across different runs using advanced statistics • ANOVA • T-test • Volcano plots • Correlation with meta data
GeneSpring MS allows you to…Use PCA for QC and Biomarker discovery
GeneSpring MS allows you to…Performs a variety of statistical analyses • Class prediction • K-nearest neighbors • SVM • Clustering • K-means • SOM • QT clustering • Hierarchical trees • Complete, average and single linkage (w. bootstrapping)
GeneSpring MS allows you to…Visualize the MS data and analysis results in a variety of ways • Variety of plots to visualize • RT vs Mass plots • RT vs Ratio • Mass vs Ratio • Graphs of abundance across conditions • Scatter plots • Chromatograms
GeneSpring MS allows you to…Find the identity of proteins or metabolites • After statistical techniques have resulted in a list of “interesting peptides”, these can be searched against the database for identification Examples • Communicate directly with Spectrum Mill to run a PMF search and send back the results to GeneSpring, which updates the annotations of the peptide masses • Create inclusion lists for the Q-TOF and/or Ion-Trap • Compare the mass of a metabolite to the Metlin database for identification
Continue the workflow by creating inclusion lists for LC/MS/MS run on the QTOF or the QQQ • After finding potential biomarkers using the statistical techniques in GeneSpring MS, you can create Inclusion List files for the QTOF (or Ion Trap) and QQQ to determine identity of the biomarkers using the QTOF or to run large scale validation experiments with the QQQ
Thon de BoerGeneSpring MS Product Manager Thank you for your attention