Download

1 / 49
510 likes | 769 Views
Introduction to Rainfall & Streamflow. Philip B. Bedient January, 2006. Watershed - Elevation Contours. Water flows at right angles to elevation contours and from higher to lower elevations. Texas River Basins. Red. Trinity. Brazos. Colorado. Rio Grande. San Jacinto.

E N D
Introduction toRainfall & Streamflow Philip B. Bedient January, 2006
Watershed - Elevation Contours Water flows at right angles to elevation contours and from higher to lower elevations
Texas River Basins Red Trinity Brazos Colorado Rio Grande San Jacinto
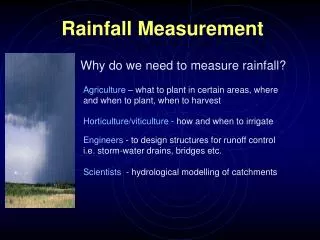
I. Mechanisms of Rainfall • Convective Storms - Radiational • Low Pressure Systems - tropical storms and hurricanes • Frontal Systems - Cold or Warm • Dew and Fog • Hail and Ice Storms • Condensation
Thunderstorm cell with lightning Characterized by updrafts and downdrafts Strong convergence and divergence Most intense rainfall possible
Hurricane IvanSeptember, 2004 • Ivan spawned tornadoes from Florida into Alabama with deaths reported near Panama City and Tallahassee. • Waves as high as 50 feet were measured 75 miles south of Dauphin Island. Ivan steadily moved northward through Alabama. • Hurricane Ivan’s devastating march was precisely predicted because a ridge of high pressure around the Bahamas steered it • The combination of slow speed and no clear zones of low and high pressure created the potential disaster zone of more than 350 miles across.
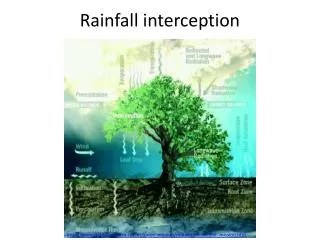
Formation of Precipitation Source of moisture Lifting mechanism (orographic or heating) Phase change from vapor to water - Energy Small nuclei or dust for droplet formation Droplets must grow as they fall to earth
Fronts and Low Pressure • Cold/Warm Front • Lifting/Condensation • High and Low Pres • Rainfall Zone • Circulation Issues • Main weather makers
Warm Cold Winds increase as cold front approaches
Major Storm Damages • Intense Rainfalls • 8 to 15 inches • Severe Flooding • Billion$ damages • Lost productivity
Hurricane Andrew -1992 • Formed in the Atlantic • Moved to Florida coast • Winds in excess of 150 • Major damage to Florida • Moved over Gulf and strengthened and hit LA • Most damaging until 2005
Hurricane Katrina in the Gulf - 8/29/2005 Katrina 08-28-2005 at 17:00 UTC
Measuring Rainfall - Tipping Bucket • Recording gage • Collector and Funnel • Bucket and Recorder • Accurate to .01 ft • Telemetry- computer • HCOEM website
Largest One Day U.S. Total Rainfall • Alvin, Texas • **43 inches in 24 hours** • Measured in one gage • Associated with T.S. Claudette in July 1979 • Texas accounts for 12 world rainfall records
The Hyetograph • Graph of Rainfall Rate (in/hr) vs Time (hr) at a single gage location • Usually plotted as a bar chart of gross RF • Net Rainfall is found by subtracting infiltration • Integration of Net Rainfall over time = Direct RO Vol (DRO) in inches over a Watershed
Design Rainfalls • Design Storm from HCFCD and NWS • Based on Statistical Analysis of Data • 5, 10, 25, 50, 100 Year Events • Various Durations of 6 to 24 hours Six Hour Rainfall
Rainfall Analysis Center of Mass of rainfall in time T = S ti Pi/ S Pi Avg intensity I = S Pi /n Six Hour Rainfall
Intensity-Duration-Frequency • IDF design curves • All major cities • Based on NWS data • Various return periods & durations • Used for drainage design of pipes & roads • Used for floodplain designs - watersheds
Thiessen Polygons - Areal Average Rainfall from Gages • Connect gages with lines • Form triangles as shown • Create perpendicular bisectors of the triangles • Each polygon is formed by lines and WS boundary P = S (Ai*Pi) / AT
II. STREAMFLOW Brays Bayou - Main St
Typical Streamflow Gage High Flow
TS Allison level reached 41.8 ft MSL TMC is at 44 ft & Rice Univ is at 50 ft
Brays Flooding at Loop 610 - 1983 Main Channel Overbank
Stream Cross-Section for Q • Measure V (anemometer) at 0.2 and 0.8 of depth • Average V and multiply by (D width * depth) • Sum up across stream to get total FLOW • Q = S (Vi Di DWi)
Instantaneous Hydrograph • Rainfall falls over the basin • Intensity I reaches the outlet - response based on travel time • Produces a total storm response hydrograph as shown • Little delay and no storage • The above only occurs in small urban basins or parking lots Ii Small Basin Qi = Ii A
Unit Hydrograph (UH) Method • Linear transform method • Converts complex rainfall to streamflow at outlet • Produces a total storm hydrograph from given UH • Used in complex watersheds • Each subarea is unique • Storage effects considered Pi Uj Q T Qn = Pn U1 + Pn-1 U2 + Pn-2 U3 + … +P1 Uj
Time-Area Method • Watershed travel times • Time Area Graph • Rainfall Intensities • Add and Lag Method • Resulting Hydrograph
Time Area Hydrograph Peak Flow at Q2 • Q1 = P1 * A1 • Q2 = P2*A1 + P1*A2 • Q3 =P3*A1 + P2*A2 + P1*A3 • And So Forth At time step 2, P2 over A1 and P1 over A2 arrive at the same time - Similar for time step 3 with 3 contributors
The Hydrograph • Graph of discharge vs. time at a single location • Rising Limb, Crest Segment, Falling Limb,and Recession • Base Flow is usually subtracted to yield DRO • Peak gives the maximum flow rate for the event • Area under curve yields volume of runoff (inches)
Hydrograph - Watershed Flow Response to Rainfall • Peak Flow and time to peak relate to area/shape of watershed • Area under curve is the volume of DRO • Time Base is time that flow exceeds baseflow • Time to peak or Lag is measured from center of mass of rainfall pattern Lag or time to peak Peak Flow Hydrograph RF Outflow Volume of Runoff DRO Time Base Time
Rainfall and Runoff Response Flow Measured from USGS Gage 403 Inside Harris Gully RF Q Rainfall Measured from USGS Gage 400 at Harris Gully Outlet February 12, 1997 on Harris Gully Net Rainfall * Area = integration of direct runoff hydrograph Vol under blue bars * Area = Volume under red line (hydrograph)
Hydrograph Flood Routing from Point 1 to Point 2 Once overland flow arrives at a stream - becomes channel flow Channel flow begins as low flow and increases with accumulation Flood wave moves downstream at a predictable velocity Subarea flows contribute to the flood wave along the stream Wave maximum near outlet**
Hydrograph Flood Routing from Pt 1 to Pt 4 in the Stream G and F to Pt 1 Pt 1 to Pt 2 D to Pt 2 Pt 2 to Pt 3 E, C, and B to Pt3 Pt 3 to Pt 4 A to Pt 4 Compute Final hydrograph 1 2 3 4
Hydrograph Flood Routing to Next Downstream Location Crest 1 Falling Limb Rising Limb 2 Recession Time Base of Hydrograph Flood wave is lagged and attenuated as it moves downstream
Hurricane Katrina - Most Damaging Storm in U.S. History Mississippi New Orleans $100 billion loss