Download
1 / 57
570 likes | 736 Views
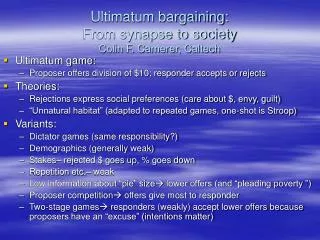
Modeling Bargaining Behavior in Ultimatum Games. Haijin Lin and Shyam Sunder Japan Association for Evolutionary Economics Ochanomizu, Tokyo, Japan March 25-26, 2000. Ultimatum Game. Two players divide a given amount (the pie =1) between them

E N D
Modeling Bargaining Behavior in Ultimatum Games Haijin Lin and Shyam Sunder Japan Association for Evolutionary Economics Ochanomizu, Tokyo, Japan March 25-26, 2000
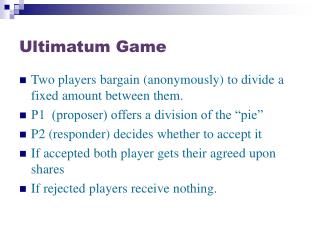
Ultimatum Game • Two players divide a given amount (the pie =1) between them • Player 1 proposes a division (d for self, 1-d) for player 2 • Player 2 may either accept (in which case the proposal is implemented) or reject (in which case both players receive 0) • Game ends Lin and Sunder, Modeling Bargaining Behavior in Ultimatum Games
Subgame Perfect Equilibrium • Assume that payoff from the game is the only argument in player 2s preferences • Preferences are increasing in personal payoffs • Player 2 should accept any positive amount • In subgame perfect equilibrium, player 1 demands all but the smallest fraction of the pie, and player 2 accepts this fraction Lin and Sunder, Modeling Bargaining Behavior in Ultimatum Games
Laboratory Results • Few observations correspond to the subgame perfect equilibrium • Modal Player 1 proposal is 50/50 split • In most observations, Player 1s demands lie in 50 to 70 percent range • Player 2 rejects a significant number of proposals that offer them positive amounts, even significantly positive amounts Lin and Sunder, Modeling Bargaining Behavior in Ultimatum Games
Why This Discrepancy Between Data and Theory? • Guth, Schmittberger and Schwarze (1982) • Average demand of player 1 = 67% • Rejection rate by player 2 = 20% • Explanations: subjects often rely on what they consider a fair or justified result. • Ultimatum difficult to exploit because Player 2 willing to punish Player 1 who asks for too much Lin and Sunder, Modeling Bargaining Behavior in Ultimatum Games
Why This Discrepancy Between Data and Theory? • Binmore, Shaked, and Sutton (1985): 1-stage and 2-stage game with .25 discount • In 1-stage game, modal demand=75 %(vs.1) • In 2-stage game, modal demand in round 1 =50% (vs.75%), rejection rate =15% • Differences consistent with subgame perfect Eq. predictions for the two games • Useful predictive role for game theory Lin and Sunder, Modeling Bargaining Behavior in Ultimatum Games
Why This Discrepancy Between Data and Theory? • Guth and Tietz (1988): two 2-stage games, with discounts of 90 and 10 percent • Discount 0.1, demand 76 to 67% (vs. 90%) • Discount 0.9, demand 70 to 59 % (vs.10%) • Game theoretic solution seems to have predictive power only when its solutions are in socially acceptable range Lin and Sunder, Modeling Bargaining Behavior in Ultimatum Games
Why This Discrepancy Between Data and Theory? • Neelin, Sonnenschein, and Spiegel (1988): two-, three- and five-period games • Data for all three games close to perfect eq. predictions of two-period games • Reject both Stahl/Rubinstein theory as well as the equal split model Lin and Sunder, Modeling Bargaining Behavior in Ultimatum Games
Why This Discrepancy Between Data and Theory? • Ochs and Roth (1989): eight games, 2- and 3-period, different discount rates for players • Different aspects of the data are consistent with conclusions of different prior studies • Frequent disadvantageous counter proposals • Perceptions of fairness may be important • Anticipating fairness preferences of others Lin and Sunder, Modeling Bargaining Behavior in Ultimatum Games
Why This Discrepancy Between Data and Theory? • Thaler (1988): utility includes arguments other than money • Guth and Tietz (1990): players shift between strategic and equitable thinking hierarchically (consider one at a time) • Kennan and Wilson (1993): games of incomplete information • Model uncertainty about otherspreferences Lin and Sunder, Modeling Bargaining Behavior in Ultimatum Games
Why This Discrepancy Between Data and Theory? • Bolton (1991): utility function with two arguments, income and share of the pie • Forsythe, Horowitz, Savin, Sefton (1994): dictator game modal offer is subgame perf.; reject fairness as dominant factor • Kahneman, Knetch, Thaler (1986): subjects willing to sacrifice personally to punish-reward past behavior seen to be unfair-fair Lin and Sunder, Modeling Bargaining Behavior in Ultimatum Games
What do we do? • Reanalyze prior data to develop a model • Abandon extreme assumption about Player 1s belief about Player 2s strategy • Use data to estimate reasonable models (static and dynamic) of Player 2s strategy and Player 1s beliefs • Compare predictions of the models on remaining data Lin and Sunder, Modeling Bargaining Behavior in Ultimatum Games
To Those Who Share Their Data: Thank You! • Slembeck (1999): 19 fixed pairs play 20 consecutive rounds of single-stage ultimatum game • Guth et al. (1982) • Guth and Tietz (1988) • Ochs and Roth (1989) • Neelin et al. (1988) Lin and Sunder, Modeling Bargaining Behavior in Ultimatum Games
Player 2s Decisions • Do the chances of acceptance of a proposal by Player 2 depend on the size of Player 1s demand? • Reanalyze the data for the first and the last 10 rounds separately (no important change) • Result: Relative frequency of acceptance by Player 2 declines as Player 1 demands more Lin and Sunder, Modeling Bargaining Behavior in Ultimatum Games
Figure 1: Frequency of Acceptance in Slembeck (1999) data(No. of observations at the top of each bar) Lin and Sunder, Modeling Bargaining Behavior in Ultimatum Games
Figure 2: Frequency of acceptance in data from other prior studies(No. of the observations at the top of each bar) Lin and Sunder, Modeling Bargaining Behavior in Ultimatum Games
Player 1s Beliefs About Player 2s Decision Rule • Traditional Assumption • Player 2 will accept all proposals d1 < 1 with probability 1 • Player 2 will reject proposals d1 = 1 • Yields subgame perfect equilibrium Lin and Sunder, Modeling Bargaining Behavior in Ultimatum Games
Figure 3: Assumptions about Player 2s Behavior (A) Frequency of Acceptance 1 1 Fraction Demanded by Player 1 Lin and Sunder, Modeling Bargaining Behavior in Ultimatum Games
Player 1s Beliefs About Player 2s Decision Rule • Alternative assumption: probability of acceptance declines in a straight line from d1=0 to d1=1. • With this belief, Player 1 maximizes his expected payoff if he demands a 50/50 split Lin and Sunder, Modeling Bargaining Behavior in Ultimatum Games
Figure 4: Assumptions about Player 2s Behavior (B) Frequency of Acceptance 1 1 Fraction Demanded by Player 1 Lin and Sunder, Modeling Bargaining Behavior in Ultimatum Games
Player 1s Beliefs About Player 2s Decision Rule • More generally, define a class of decreasing functions of d1 including the above two as special cases • We pick rectangular hyperbolas that pass through points (1,0) and (0,1) • This is a single parameter (a) family of functions so we can easily estimate the parameter from the data Lin and Sunder, Modeling Bargaining Behavior in Ultimatum Games
Specification of Probability of Acceptance Function Lin and Sunder, Modeling Bargaining Behavior in Ultimatum Games
Figure 5: One Family of Probability Functions with Parameter a Lin and Sunder, Modeling Bargaining Behavior in Ultimatum Games
Estimation of Probability Function from Data • One half of Slembeck data (odd numbered rounds from odd numbered pairs, even numbered rounds from even pairs), 190 • Least squares estimate: min • Max. Likelihood Estimate: • max Lin and Sunder, Modeling Bargaining Behavior in Ultimatum Games
Figure 6: Static Model Estimated by Using Slembeck Data (1999)(LSE(a) = 1.57; MLE(a) = 1.46) Lin and Sunder, Modeling Bargaining Behavior in Ultimatum Games
Panel B: Relative Frequency and Estimated Model for Second Half of the Slembeck Data(LSE (a) = 1.42, MLE (a) = 1.34) Lin and Sunder, Modeling Bargaining Behavior in Ultimatum Games
Statistically • Cannot reject the null hypothesis that the parameter estimates of a from the two halves of the Slembecks data are equal (Chows test) • Estimates from the whole sample: • LSE(a) = 1.49 • MLE(a) = 1.4 Lin and Sunder, Modeling Bargaining Behavior in Ultimatum Games
Optimal Demand of Player 1 • Conditional on a given value of parameter a, we can derive the expected value maximizing demand of Player 1: • See Figure 7 • For a = 1.4, d* = 0.62; a = 1.49, d* = 0.61 Lin and Sunder, Modeling Bargaining Behavior in Ultimatum Games
Figure 7: Dependence of Optimal Demand d on Parameter a Lin and Sunder, Modeling Bargaining Behavior in Ultimatum Games
How Do Player 1s Decisions Correspond to the Model • Two continuous lines in Fig. 8 are the expected value of demand d (MLE, LSE) • Vertical bars are the actual frequency of demand (modal d in range 0.4 < d 0.5) • Modal value less than the optimal point estimates (0.62, 0.61) • Crude inverted U correspondence of demand frequency to expected value Lin and Sunder, Modeling Bargaining Behavior in Ultimatum Games
Figure 8: Expected Value and Actual Frequency of Demand (d) in Slembeck (1999) Data(Frequency of Acceptance at the top of each bar)(LSE (a) = 1.49, MLE (a) = 1.40) Lin and Sunder, Modeling Bargaining Behavior in Ultimatum Games
Static Vs. Dynamic Model • Static model organizes data (compare to perfect and fairness predictions) • Assumed parameter a unchanged over • rounds of subject experience • across pairs of players • between paired player 2 and belief of player 1 • Can we do better by allowing learning and estimating separately for each pair? Lin and Sunder, Modeling Bargaining Behavior in Ultimatum Games
Specifying the Dynamic Model • jth player 2 adjusts her threshold acceptance value yjt by first order adaptive process • yjt = jyjt-1 + (1-j)dit • Represent jth player 2s decision in period t by Djt • Djt= 0 if dit > yit, and Djt = 1 if dit yit • ith player 1submits his demand dit= xit, leaving no money on the table • ith player 1 adjusts xit based on player 2s decision • xit+1 = xitiDjt i(1-Djt) Lin and Sunder, Modeling Bargaining Behavior in Ultimatum Games
Estimating the Dynamic Model • Use the data for each pair to estimate three parameters (yj0, j, i ) • Use Excel Solver to obtain two sets of estimates by minimizing • (1) the sum of squared errors between actual and estimated player 1s decision: t (dit - d`it)2 • (2) the sum of squared errors between actual and estimated player 2s decision: t (Dit - D`it)2 Lin and Sunder, Modeling Bargaining Behavior in Ultimatum Games
Table 1: Parameter Estimates from Dynamic Model(Pairs 1-10) Lin and Sunder, Modeling Bargaining Behavior in Ultimatum Games
Table 1: Parameter Estimates from Dynamic Model(Pairs 1-10) Lin and Sunder, Modeling Bargaining Behavior in Ultimatum Games
Dynamic Parameter Estimates (Player 1 Decision Optimization) • Player 2s initial threshold: 0.41-0.66 (0.51) • Player 2s adaptive parameter:0.81-1 (0.91) • Player 1s adaptive parameter: 1-1.12 (1.07) • Variation explained on average: 60 percent Lin and Sunder, Modeling Bargaining Behavior in Ultimatum Games
Lin and Sunder, Modeling Bargaining Behavior in Ultimatum Games
Dynamic Parameter Estimates (Player 2 Decision Optimization) • Player 2s initial threshold: 0.38-0.56 (0.5) • Player 2s adaptive parameter:0.64-0.96 (0.86) • Player 1s adaptive parameter: 1-1.09 (1.05) • Errors in predicting Player 2 decision on average: 25 percent Lin and Sunder, Modeling Bargaining Behavior in Ultimatum Games
Lin and Sunder, Modeling Bargaining Behavior in Ultimatum Games
Model Comparisons • Compare various aspects of data against perfect equilibrium, fairness, global static, and dynamic models • Time series of Player 1 decisions • Cumulative frequency of Player 1 decisions • Distribution of rewards between Players 1 and 2 • Efficiency/Acceptance rate Lin and Sunder, Modeling Bargaining Behavior in Ultimatum Games
Model Comparison: Time Series of Player 1 Decisions • Panels of Fig. 10 show actual and model (static and dynamic) time series of di for pairs 3-8 (pairs 1 and 2 used 50/50 splits) • Static model captures the mean of the process across all pairs • Dynamic model tracks time series better by using up more degrees of freedom (yet to deal with the dependency problem) Lin and Sunder, Modeling Bargaining Behavior in Ultimatum Games
Figure 10: Time Series Charts of Actual and Dynamic Model Demands of Player 1 Lin and Sunder, Modeling Bargaining Behavior in Ultimatum Games
Figure 10: Time Series Charts of Actual and Dynamic Model Demands of Player 1 Lin and Sunder, Modeling Bargaining Behavior in Ultimatum Games
Figure 10: Time Series Charts of Actual and Dynamic Model Demands of Player 1 Lin and Sunder, Modeling Bargaining Behavior in Ultimatum Games
Figure 10: Time Series Charts of Actual and Dynamic Model Demands of Player 1 Lin and Sunder, Modeling Bargaining Behavior in Ultimatum Games
Figure 10: Time Series Charts of Actual and Dynamic Model Demands of Player 1 Lin and Sunder, Modeling Bargaining Behavior in Ultimatum Games
Figure 10: Time Series Charts of Actual and Dynamic Model Demands of Player 1 Lin and Sunder, Modeling Bargaining Behavior in Ultimatum Games
Model Comparison: Cumulative Frequency of Player 1 Decisions • Figure 8A compares the cumulative frequency of Player 1s decisions against perfect eq., fairness benchmarks, and the global static model • Fairness corresponds to the mode • Global static captures the average • (Add dynamic model) Lin and Sunder, Modeling Bargaining Behavior in Ultimatum Games
Lin and Sunder, Modeling Bargaining Behavior in Ultimatum Games