Download
1 / 23
230 likes | 334 Views
Computation of Surface Longwave Fluxes Effect of Skin-Air Temperature Differences. Shashi K. Gupta, Paul W. Stackhouse Jr.*, Taiping Zhang, and J. Colleen Mikovitz Climate Science Branch, Science Directorate NASA Langley Research Center (LaRC) Hampton, Virginia

E N D
Computation of Surface Longwave FluxesEffect of Skin-Air Temperature Differences Shashi K. Gupta, Paul W. Stackhouse Jr.*, Taiping Zhang, and J. Colleen Mikovitz Climate Science Branch, Science Directorate NASA Langley Research Center (LaRC) Hampton, Virginia *PI: NASA/GEWEX Surface Radiation Budget (SRB) Project LANDFLUX Assessment and Organization Workshop Toulouse, France 28-31 May 2007
The NASA/GEWEX SRB Dataset • A 22-year (Jul1983-Jun2005) dataset produced at LaRC • Monthly, Daily, Monthly/3-Hourly, and 3-Hourly at 1°x1° • Algorithms: Primary and Quality-Check - SW and LW • Input Data: Cloud Properties Derived from ISCCP-DX Meteorological Profiles from GEOS-4 Column Ozone: TOMS and TOVS Archives • Validation Data: BSRN, WRDC, and GEBA Archives • Submitted to GEWEX Radiative Flux Assessment • Dataset and ancillary information will be available at: http://eosweb.larc.nasa.gov/PRODOCS/srb/table_srb.html
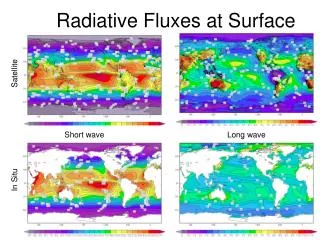
22-Year Average Surface Radiative Fluxes SW LW PR QC
Multi-Year Global Averages * Normalized to S0 = 1367 W m-2 ; (F0 = S0/4)
Introduction • SRB Longwave Algorithms: • GEWEX LW (Fu/Stackhouse): CERES 2/4-Stream LW model (Fu et al., 1997), maximum-random cloud overlap, CERES spectral surface emissivity. Results: TOA and Surface, 3-Hourly, Daily, Monthly/3-Hourly, and Monthly data products. • GEWEX LW QC (Gupta et al., 1989, 1992): RT based parameterizations for clear/cloudy downward LW fluxes, CERES broadband surface emissivity. Results: Surface 3-Hourly, Daily, Monthly/3-Hourly, and Monthly data products. • Both models overestimate DLF for some regions at the high end of DLF range. • Determine the cause, assess the magnitude, and develop a remedy for this overestimation.
Comparison of 3-Hourly Fluxes With BSRN Data Primary Quality-Check Investigate the cause focussing on the quality-check model
WHAT IS CAUSING IT AND WHERE? • Effective Emitting Temperature: Teff = 0.60 Ts + 0.35 T1 + 0.05 T2 Ts - Surface skin temperature T1 - Average temperature for Sfc. - 800 mb layer T2 - Average temperature for 800 - 680 mb layer • Works well when Ts, T1, and T2 conform to nominal lapse rate requirements. • When Ts >> T1 (and T2), it results in overestimation of DLF. • Mostly over dry/arid regions during hot times of day.
Weighting Function for DLF Reaching the Surface (U.S. Standard Atmosphere - 50 mb Layers)
Methodology • Selected two sites for study: Alice Springs, Australia - Dry/Arid Goodwin Creek, MS (USA) - Moderate/Humid • Performed flux computations using a stand-alone version of the quality-check model on a 3-hourly time resolution for all months of 2000. • Compared model-derived DLF with ground-based observations for the above sites obtained from BSRN.
Analysis of Alice Springs Overestimation • Points with overestimation of > 100 Wm-2 32 points during the year (16 in Jan; 20 in DJF) Mean = 120 Wm-2; Range: 100-160 Wm-2 Ts: Mean = 324.3 K; Range: 302-336 K Ps: Mean = 939 mb; Range: 935-946 mb T800: Mean = 292.1 K; Range: 284.7-297.7 K Ts - T800: Mean = 32.2 K; Range: 17.0-40.3 K • Ts - T800 should be about 10 K, but no more than 15 K • Decided that lapse rates > 10K/100mb in the lower layer are too steep, and need to be adjusted. • Adjusted skin temperature to not exceed 10K/100mb limit.
Results From the Modified Computation Alice Springs Goodwin Creek Bias for Alice Springs - reduced greatly; Change for Goodwin Creek - minimal
Monthly Temperature Adjustment and Frequency Temperature Adjustment Adjustment Frequency Jan Jul
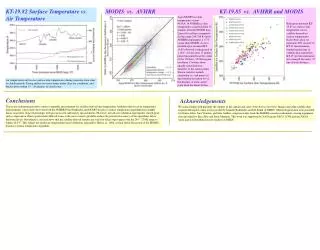
Model-Derived vs. Ground-Measured BSRN DLF(Primary Model) Alice Springs Goodwin Creek Alice Springs: Slight overestimation at the high end; small negative bias overall.
Model-Derived vs. Ground-Measured DLF(Primary Model)Alice Springs Some overestimation at the high end during DJF; underestimation during JJA
Summary and Future Work • Determined the cause of DLF overestimation: Occurs when skin • temperature (Ts) is much higher than atmospheric temperatures. • Instantaneous overestimation can be 100 Wm-2 or even more. • Developed a method for detecting this condition and constraining • Ts prior to using it in DLF computation, largely eliminating the bias. • Constrained Ts is not used for upward flux computation. • Tested method with quality-check model for all months of 2000. • Similar analysis is underway for the primary LW algorithm. • Results of analysis to be applied in the next round of processing.
Model-Derived vs. Ground-Measured BSRN DLF(Quality-Check Model) Alice Springs Goodwin Creek Significant overestimation over Alice Springs; almost none over Goodwin Creek
Model-Derived vs. Ground-Measured DLF(Quality-Check Model)Alice Springs Severe overestimation during DJF; slight underestimation during JJA
Comparison of Daily Averages With BSRN Data Primary Quality-Check Overestimation not so apparent after diurnal averaging
Surface and Atmospheric Temperatures Over Sea of Japan - January 2000
Surface Skin Temperature From Different Datasets Jan2000 Jul2000 GEOS-4 ISCCP Primary LW