Download
1 / 18
210 likes | 389 Views
Ocean Surface heat fluxes. Department of Physical Oceanography Woods Hole Oceanographic Institution. Lisan Yu Robert A. Weller. NOAA Climate Observation Division 5 th Annual System Review Silver Spring, Maryland. June 5-7, 2007. Ocean heat fluxes: a key climate variable. Solar.

E N D
Ocean Surface heat fluxes Department of Physical Oceanography Woods Hole Oceanographic Institution Lisan Yu Robert A. Weller NOAA Climate Observation Division 5th Annual System Review Silver Spring, Maryland. June 5-7, 2007
Ocean heat fluxes: a key climate variable Solar water vapor & latent heat Precipitation Longwave Sensible heat Evaporation Salinity Temperature Energy budget: Net heat flux = Solar– Longwave – Latent heat – Sensible heat Water cycle: Freshwater flux = Precipitation–Evaporation
Estimating ocean heat fluxes • There are NO direct measurements of global surface heat fluxes. • There are direct measurements for most air-sea variables. • Fluxes are computed from bulk parameterizations. Latent heat flux: QLH = Le ceU ( qs – qa) Sensible heat flux: QSH = cp cpU ( Ts – Ta) qa, Ta U qa and Ta are not available from satellites, but are provided by NWP reanalyses. qs, Ts
Objectively Analyzed air-sea Fluxes (OAFlux)website: http://oaflux.whoi.edu/ • OAFlux products are computed from COARE 3.0 bulk flux parameterization with surface meteorology determined from an objective analysis of satellites and atmosphere reanalyses (ECMWF, NCEP). • Data currently available for the years 1958-2006 on global 1 grid: – latent heat – sensible heat – evaporation – wind speed – near surface air humidity – near surface air temperature – sea surface temperature
Mean and Differences: 2006 versus 2005 Mean 2006 Difference: 2006 - 2005
Yearly averaged ocean heat fluxes and SST: 1958 - 2006 LHF+SHF LHF SHF Evaporation increases in concert with the rise of SST SST The Clausius-Clapeyron equation
Linear trends in latent heat flux and SST: 1981-2006 • Heat fluxes are nonlinear functions of SST: • QLH~ U ( qs(TS) – qa ) • QSH~ U ( Ts – Ta )
Decadal variations of latent heat fluxdepicted by model and ship based products Except for ERA40, all flux products show an increase of latent heat loss since the early 1980s.
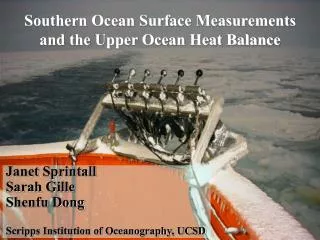
Locations of in situ measurements All components No QLW x No QLW and QSW
Product - buoy comparison LHF SHF SW Mean Diff (Product – Buoy) LW OAFlux+ISCCP ERA40 NCEP1 NCEP2 NET
Importance of long-term flux buoys: quantify bias in NWP fluxes Stratus buoy (693 days, 10/08/00 to 08/31/02 ) Fluxes comparison statistic based on daily means ---------------------------------------------------------------------- QNETQLH+QSHQSW+QLW ---------------------------------------------------------------------- Buoys 50 -110 160 OAFlux&ISCCP 54 ( +4) -113 ( -3) 168 ( +8) NCEP1 -14 (-64) -144 (-34) 130 (-30) ERA40 47 ( -3) -124 (-14) 171 (+11) ----------------------------------------------------------------------
NWP fluxes are poorly compared with buoys,but how can they achieve a global balance? Averages over global ocean grid points
Correction made on the NCEP net heat flux by data assimilated ECCO models Differences (ECCO – NCEP) NCEP Mean Qnet NCEP overestimates the ocean heat gain at high latitudes, while underestimate it in mid and low latitudes. Does NCEP have a right global heat balance? Item 8: “Surface fluxes”, Ocean Reanalysis Evaluation. ECMWF, Aug 31 – Sep 1, 2006
Differences between the 9 annual-mean fields The surface fluxes from the ocean models are dependent upon the model’s ability to resolve the ocean frontal dynamics.
Summary • Does NCEP or ERA40 global heat balance represent the right balance? – Unknown. • Has the global ocean evaporation been increasing since the 1980s? – It is depicted by all products except ERA40, but the magnitude of increase is uncertain. • How has the global radiation (short plus longwave) been changing during the same period? – Uncertain. • Long-term sustained flux observations, particularly • in extra tropical regions, are highly needed • – to reduce bias in flux products • – to provide accurate reference for accessing • long-term climate change in air-sea exchanges • – to reconcile differences between ocean reanalyses, • atmospheric reanalyses, and global flux analyses • –to,eventually,achieve and understand the global • heat balance