Download
1 / 37
370 likes | 377 Views
Technology Life Cycle Analysis Modelling based on Patent Documents ]. The 4th International Seville Conference on Future-Oriented Technology Analysis (FTA) 12 & 13 May 2011. Lidan Gao, 1,2 Alan L Porter, 3 Jing Wang, 4 Shu Fang, 1 Xian Zhang, 1 Tingting Ma, 5 Wenping Wang, 5 Lu Huang 5.

E N D
Technology Life Cycle Analysis Modelling based on Patent Documents ] The 4th International Seville Conference onFuture-Oriented Technology Analysis (FTA)12 & 13 May 2011 Lidan Gao,1,2 Alan L Porter,3 Jing Wang,4 Shu Fang,1 Xian Zhang,1 Tingting Ma,5 Wenping Wang,5 Lu Huang5 1 Chengdu Library of the Chinese Academy of Sciences, Chengdu 610041, 2 School of Economics and Management, Southwest Jiaotong University, Chengdu 610031, 3 School of Public Policy, Georgia Institute of Technology, Atlanta, GA 30332-0345, 4 College of Computer Science & Technology, Huaqiao University, Xiamen, 361021, 5 School of Management and Economic, Beijing Institute of Technology, Beijing 100081
Technology Life Cycle Analysis Modelling based on Patent Documents Introduction Research Purpose • The rapidly changing economic environment and increasingly fierce competition require companies to be innovative, both in their products and marketing strategies, if they are to continue to flourish. A successful product must balance three components: marketing, technology, and user experience (Norman, 1998). Technology plays a key role among these three components (Ming et al). To estimate the future development of one technology and make decisions whether to invest in it or not, one needs to know the stage status of its technology life cycle (TLC).
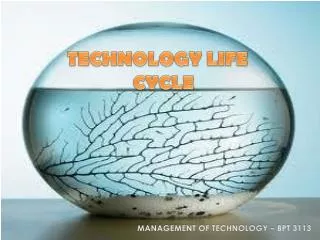
Technology Life Cycle Analysis Modelling based on Patent Documents Introduction Definition of Technology Life Cycle • The concept of the technology life cycle (TLC) was developed by Arthur (1981) to measure technological changes. According to Arthur’s definition, the characteristic of the emerging stage is a new technology with low competitive impact and low integration in products or processes. In the growth stage, there are pacing technologies with high competitive impact that have not yet been integrated in new products or processes. In the maturity stage, some pacing technologies turn into key technologies, are integrated into products or processes, and maintain their high competitive impact. As soon as a technology loses its competitive impact, it becomes a base technology. It enters the saturation stage and might be replaced by a new technology. • Ernst (1997) developed a map to illustrate it (figure 1).
Technology Life Cycle Analysis Modelling based on Patent Documents Introduction Definition of Technology Life Cycle Figure 1. The S-curve concept of technology life cycle • (Ernst H. 1997)
Technology Life Cycle Analysis Modelling based on Patent Documents Introduction Research Review • The major approach to analysing TLC with an S-curve is to observe technological performance, either over time or in terms of cumulative R&D expenditures. Usually, patent application activity is tracked as a TLC indicator for the S-curve analysis (Ernst, 1997; WenYan Zhou, 2005; Chaoming Chu, 2008). • But using one indicator only to present technological performance would be problematic. A research team from MIT (Lee et al., 1989) studied the development trends of Power Transmission technology and Aero-engine technology by S-curve. The results showed that the S-curve with a single indicator was not reliable and might lead the research in the wrong direction. • Accordingly, some multiple indicators are used to measure TLC. • Robert and Alan (1997) have introduced nine indicators that look at publications of different types during the technology life cycle. • Reinhard et al. (2007) tested seven indicators related to patents. Table1 shows the indicators listed in the two papers.
Technology Life Cycle Analysis Modelling based on Patent Documents Introduction Research Review Table1. Technology life cycle indicators by former researchers
Technology Life Cycle Analysis Modelling based on Patent Documents Introduction Research Questions • Many papers have studied some indicators that would have different performances based on the changes of technology. And some indicators have been used separately to measure the TLC stage changing. There is no research combine the multiple indicators together to measure the TLC stage changing. • In this paper, we focus on combining multiple indicators to calculate the life cycle stages for an object technology and hope that would help decision makers to estimate the future development trends of the technology.
Technology Life Cycle Analysis Modelling based on Patent Documents Methodology Research Model • The model we build to calculate the TLC for an object technology includes the following steps: • first, we focus on devising and assessing patent-based TLC indicators; • then we choose some technologies (training technologies) with identified life cycle stages; • and finally we compare the indicator features in training technologies with the indicator values in an object technology (test technology) via the Nearest Neighbour Classifier, which is widely used in Pattern Recognition, in order to measure the technology’s life cycle stages. The research framework is designed as follows.
Technology Life Cycle Analysis Modelling based on Patent Documents Figure 2. Framework of TLC analysis Figure 2. Framework of TLC analysis Figure 2. Framework of TLC analysis Methodology Research Model Figure 2. Research model of TLC analysis
Technology Life Cycle Analysis Modelling based on Patent Documents Methodology Indicators and data source • We have compiled candidate patent indicators from multiple sources. Thirteen indicators are selected for TLC assessment. • We choose the Derwent Innovation Index (DII) as the data source and VantagePoint (VP) for data cleaning and extraction. Matlab 2010b is used for implementing the algorithms. • All the data of indicators are extracted by priority year, except the first indicator. • We take nanobiosensor (NBS) as a case study to measure its technology life cycle status.
Technology Life Cycle Analysis Modelling based on Patent Documents Table 2. Technology life cycle indicators Methodology Indicators and data source Table 2. Technology life cycle indicators
Technology Life Cycle Analysis Modelling based on Patent Documents Methodology TLC stages of training technologies • It is better to choose a training technology with four TLC stages. • Cathode Ray Tube (CRT) has been developed for more than 100 years and is in the decline stage now (Yeh, 2005; Ding, 1997). But the patent information in early years is unavailable. So we choose another similar technology, the Thin Film Transistor Liquid Crystal Display (TFT-LCD), as the second training technology. • We then focus on CRT and TFT-LCD technologies and assess their life cycle stages by the Delphi method and via literature investigation. Table 3 shows the TLC stages of CRT and TFT-LCD as given by experts and literature.
Technology Life Cycle Analysis Modelling based on Patent Documents Methodology TLC stages of training technologies • Table 3 TLC stages of CRT and TFT-LCD
Technology Life Cycle Analysis Modelling based on Patent Documents Methodology Data • TFT-LCD : 12596 records in DII. • CRT: 34469 records in DII. • NBS: 1493 records in DII.
Technology Life Cycle Analysis Modelling based on Patent Documents Methodology Data Process • We develop a map for 13 indicators of each training technology. • Numbers of inventors suggest very interesting changes in different stages. Figure 3, which presents the emerging and growth stages, shows that the number of inventors is typically higher than that of all other indicators. The number of it declines in the mid-maturity stage (figure 4), but slightly increases in following years. The number of inventors is less than some other indicators, such as application numbers and priority application numbers in maturity and decline stages.
Technology Life Cycle Analysis Modelling based on Patent Documents Methodology Data Process Figure 3. Development trends of 13 indicators (TFT-LCD)
Technology Life Cycle Analysis Modelling based on Patent Documents Methodology Data Process Figure 4. Development trends of 13 indicators (CRT)
Technology Life Cycle Analysis Modelling based on Patent Documents Methodology Data Process • To make clear which indicators are similar with others in development trends, we employ cross-correlation analysis to measure the similarity among the 13 indicators in four stages. Table 4 provides the results of cross-correlation analysis (r≥0.9). • The indicators show different trends in different stages.
Technology Life Cycle Analysis Modelling based on Patent Documents Methodology Data Process • Table 4. Cross-correlation analysis for 13 indicators (r≥0.9)
Technology Life Cycle Analysis Modelling based on Patent Documents Methodology Data Process • To process multidimensional data by matrix. The original data are extracted by VP and imported into excel—13 rows of indicators, 30 columns (years) for TFT-LCD (from 1978 to 2007), 36 columns (years) for CRT (from 1972 to 2008), and 24 columns (years) for NBS (from 1985 to 2008). • We propose a normalization method with two steps to preprocess the original data. We first process the data of training technologies - TFT-LCD and CRT.
Technology Life Cycle Analysis Modelling based on Patent Documents Methodology Data Process • The first step of preprocess is data smoothing by calculating three year moving averages. The original data are defined as: • A= [A1, A2]. • Here A1, A2 represent the original data of TFT-LCD and CRT respectively.Thenthe smoothed data of TFT-LCD and CRT are defined as: • represent the smoothed data of TFT-LCD and CRT respectively.
Technology Life Cycle Analysis Modelling based on Patent Documents Methodology Data Process • The next step is to divide the smoothed data by their maximums. The normalized data are defined as: • represent the normalized data of TFT-LCD and CRT respectively.
Technology Life Cycle Analysis Modelling based on Patent Documents Methodology Data Process • We then apply the same normalization steps to the NBS data. The smoothed data and the final normalized data of NBS are defined as , respectively,
Technology Life Cycle Analysis Modelling based on Patent Documents Methodology Data Process • Then the nearest neighbour (NN) classifier is applied to the normalized data to measure the stage status of NBS. • The normalized data of TFT-LCD and CRT form the training set . There are 30 training points in the TFT-LCD training set, 36 training points in the CRT training set. • The normalized data of NBS are considered as test set . There are 24 test points in the NBS test set. • The training points and test points are defined as:
Technology Life Cycle Analysis Modelling based on Patent Documents Methodology Data Process • Since we have the TLC stages of TFL-LCD and CRT, we can form the label set of training set: • represents TLC stages of TFT-LCD and CRT.
Technology Life Cycle Analysis Modelling based on Patent Documents Methodology Data Process • For a training point and test point , the distance between and is defined as: • For each test point , we compute the distance between and all the training points and find the nearest training point (Figure 5), that means:
Technology Life Cycle Analysis Modelling based on Patent Documents Methodology Data Process Figure 5. An example for computing the distance between test point and training points
Technology Life Cycle Analysis Modelling based on Patent Documents Methodology Data Process • Then the label information of is considered identical as that of , namely or . In order to obtain all label information for NBS, we have to calculate the minimum distance between each test point and all the training points and then obtain all the label information of , that is the TLC stage information of NBS.
Technology Life Cycle Analysis Modelling based on Patent Documents Results and policy impact/implications • Table 5 shows the label results for each test point of NBS. The label information of the first 12 test points (1985–1996) of NBS can be matched with that in the emerging stage of TFT-LCD, and the label information of the second 12 test points (1997–2008) of NBS can be matched with that in the growth stage of TFT-LCD. • The TLC stages of NBS are: • Emerging stage ( =1): 1985–1996 • Growth stage ( =2): 1997–
Technology Life Cycle Analysis Modelling based on Patent Documents Results and policy impact/implications Table 5 TLC stages of NBS
Technology Life Cycle Analysis Modelling based on Patent Documents Results and policy impact/implications • According to the experts’ opinion, the results are reasonable. Therefore, NBS is still in its growth stage. • According to the definition of TLC, in a technology’s growth stage, there are pacing technologies with high competitive impact that have not yet been integrated into new products or processes. That means, some product-related technologies may be commercialized in the future; however, at the moment, these technologies need more work in order to resolve key problems. The most successful commercial biosensor technology—surface plasmon resonance—doesn't have a very good limit of detection (LOD), the nanoparticle based SPR (or local SPR) can provide excellent LOD. However, the current fabrication technology is expensive (David et al., 2008). In this stage, a lot of challenging problems must be overcome, such as enhancement of gene array and protein array, and some new and promising technologies are still under research (Gerald et al., 2009).
Technology Life Cycle Analysis Modelling based on Patent Documents Conclusions • The study is based on patent documents. • We adopt 13 indicators that can be quantitated to measure the TLC stages of an objective technology. • We introduce the nearest neighbour classifier, which is commonly used in pattern recognition and some other fields, to process the 13-D data by calculating the nearest distance among the test point and training points to find the most similar feature in training points. Therefore, the stage of the training point with the nearest distance to the test point predicts the stage of the test point. • In this study, we take TFT-LCD and CRT as the training technologies and NBS serves as the test technology. The result shows that NBS is still in its growth stage. This method can be used not only in NBS but also in other technology fields.
Technology Life Cycle Analysis Modelling based on Patent Documents Conclusions Research Limitations • First, only two technologies serve as the training technologies to calculate the similarity feature with the objective technology (test technology). This is due to the lack of ideal training technologies with four TLC stages. So, this study resembles a laboratory test. Though the result sounds reasonable, we still need to find more technologies and obtain more data to validate the method. • Second, we did not consider the technology type. TFT-LCD and CRT are categorized as the single-technology type, but NBS is a multi-technology: it involves nanotechnology and biotechnology. Different types of technologies may have different developing patterns, especially for those technologies close to basic science, such as biotechnology. The future research should also take this into account. • Third, the classifier we used in this paper is the nearest neighbour classifier. For future study, we will test some other classifiers, such as nearest feature line (NFL) and Bayesian classifier, to improve the calculating performance.
Technology Life Cycle Analysis Modelling based on Patent Documents Acknowledgement • This research was undertaken at Georgia Tech, drawing on support from the National Science Foundation (NSF) through the Center for Nanotechnology in Society (Arizona State University; Award No. 0531194) and the Science of Science Policy Program—“Measuring and Tracking Research Knowledge Integration” (Georgia Tech; Award No. 0830207). • The findings and observations contained in this paper are those of the authors and do not necessarily reflect the views of the National Science Foundation. • The researchers deeply appreciate the financial support from the Chinese Academy of Sciences. • We are further sincerely grateful and dedicate our acknowledgement to the experts in TFT-LCD, CRT and NBS: Prof. Shouqian Ding, Prof. Linsu Tong, Prof. Zhihua Gu, Prof. Xurong Xu, Dr. Zhengchun Peng, Dr. Jud Ready; and two reviewers, Dr. Li Tang and Dr. Jian Wang, for very useful comments.
Technology Life Cycle Analysis Modelling based on Patent Documents References Alan L. Porter, Jan Youtie, Philip Shapira, David J Schoeneck. 2008. Refining search terms for nanotechnology. J Nanopart Res, 10: 715–728. Arthur D Little. 1981. The Strategic Management of Technology. Cambridge, Mass. Chu Chaoming. Using Technology Life Cycle to Analysis the Developing Trend of Thin-Film Photovoltaic Industry. National Central University, 2008. David Erickson, Sudeep Mandal, Allen H J Yang, Bernardo Cordovez. 2008. Nanobiosensors: optofluidic, electrical and mechanical approaches to biomolecular detection at the nanoscale. Microfluid Nanofluidics, 4(1-2): 33–52. Ding Shouqian. 1997. The commemoration for 100th anniversary of the cathode ray tube. Chinese Journal of Liquid Crystals and Displays, 12(3): 153–160. Donald A Norman. 1998. The life cycle of a technology: why it is so difficult for large companies to innovate? Report. http://www.nngroup.com/reports/life_cycle_of_tech.html. Ernst H. 1997. The Use of Patent Data for Technological Forecasting: The Diffusion of CNC-Technology in the Gerald A Urban. 2009. Micro- and nanobiosensors—state of the art and trends. Meas Sci Technol, 20: 1–18. Machine Tool Industry. Small Business Economics, 9(4): 361–381. Huang Lu, Peng Zhengchun, Guo Ying and Porter L Alan. 2010. Identifying the emerging roles of nanoparticles in biosensors. Journal of Business Chemistry, 7(1): 15–29. Lai Hongjia. 2003. Study on the technique development of TFT-LCD industry-based on patent analysis and life cycle theory. Chun Yuan Christian University. Lee T H, Nakicenovic N. 1989. Life cycle of technology and commercial policy. Science & Technology Review, 1:38-43. Lerner J. The Importance of Patent Scope: An Empirical Analysis. The RAND Journal of Economics, 1994, 25: 319–333. Meyer M. 2000. Does science push technology? Patents citing scientific literature. Research Policy, 29, 409-434. Ming H X G, Lu W F, Zhu C F. Technology challenges for product lifecycle management. Technical Report. STR/04/058/SP.
Technology Life Cycle Analysis Modelling based on Patent Documents References Narin F, Noma E, Perry R. 1987. Patents as indicators of corporate technological strength. Research Policy, 16, 143–155. Reinhard Haupt, Martin Kloyer, Marcus Lange. 2007. Patent indicators for the technology life cycle development. Research Policy, 36, 387–398. Robert J Watts, Alan L Porter. 1997. Innovation forecasting. Technological Forecasting and Social Change, 56, 25–47. Tipnis A Vijay. 2008.Challenges in Product Strategy, Product Planning and Technology Development for Product Life Cycle. CIRP Annals - Manufacturing Technology, 43(1): 157–162. Yeh Chiahsin. 2005. A Comparative Analysis of Taiwan’s CRT and TFT-LCD Industries –Based on the Viewpoints of Industrial Ecology and Life Cycle. Da-Yeh University, Taiwan. Zhang Xian, Fang Shu, Tang Chuan, Xiao Guohua, Hu Zhengyin, Gao Lidan. 2009.Study on Indicator System for Core Patent Documents Evaluation.Proceedings of ISSI 2009 - the 12th international conference of the International Society for scientometrics and informetrics, Rio de Janeiro, Brazil, 1: 154–164. Zhou WenYan. Probe into the research of the electric technological development trend of plasma display with the patent index. Chung Yuan Christian University, 2005.
Thanks! Lidan Gao, gld@clas.ac.cn Alan L Porter, alan.porter@isye.gatech.edu Jing Wang, wroaring@yahoo.com.cn