Download
1 / 44
440 likes | 577 Views
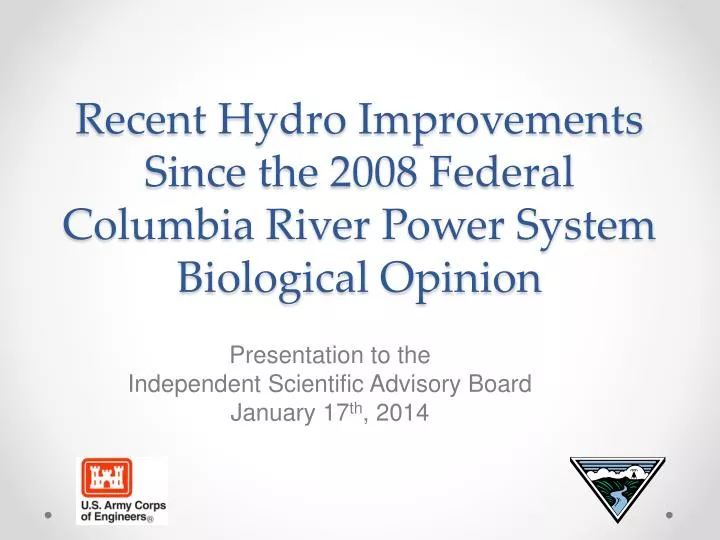
Recent Hydro Improvements Since the 2008 Federal Columbia River Power System Biological Opinion. Presentation to the Independent Scientific Advisory Board January 17 th , 2014. Two Part Agenda. Part I. Overview of Recent Improvements in the FCRPS Hydrosystem

E N D
Recent Hydro Improvements Since the 2008 Federal Columbia River Power System Biological Opinion Presentation to the Independent Scientific Advisory Board January 17th, 2014
Two Part Agenda • Part I. Overview of Recent Improvements in the FCRPS Hydrosystem • Part II. Questions and Concerns surrounding the proposed spill test (Dr. Skalski- University of Washington)
Results of Action Agencies (Federal) Non- Hydro Investments since 2007 • Added 180 miles of stream complexity. • Restored 135,000 acre-feet of water to streams increasing habitat. • Opened nearly 2,000 habitat miles (2x length of Columbia River). • Protected or Restored 3,700 acres of estuary floodplain habitat. • Hatchery evaluations and reforms • Predation Management (avian, piscine, marine mammal)
Overview:The 2008 hydro plan is underway and deserves a chance to show results • Congress and BPA ratepayers, in collaboration with the region, have invested heavily in recent years to achieve performance standards and in-river survival targets. • Research guides passage improvements at each dam. • Rigorous testing measures progress toward performance standards and in-river survival targets. • Physical models determine best spill patterns at each dam and avoid adverse effects. • Current action plan (2008-2018) includes major dam modifications (e.g. The Dalles Spill Wall), surface passage, project specific spill volumes and patterns, turbine screens and relocation of bypass outfalls. • Results so far are demonstrating improved fish survival. • Actions and testing are still underway; it is too early to change course. 4
Implementation of 2008/10/14 BiOpConfiguration Improvements 6
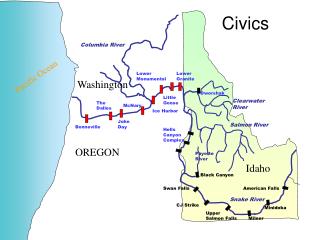
Implementation of 2008/10/14 BiOpConfiguration Improvements • Hydropower Strategy 2 – Modify Columbia and Snake River Dams to Maximize Juvenile and Adult Fish Survival • Numerous configuration improvements to increase fish survival have been completed since 2007 and include: • Minimum gap runner turbines at Bonneville Dam Powerhouse I • Adult fish ladder improvements at John Day Dam • Juvenile screened bypass system improvements and/or outfall relocation at Bonneville, McNary, Lower Monumental, and Little Goose dams • Juvenile screened bypass system full-flow PIT detection at Bonneville, John Day, Lower Monumental, and Little Goose dams • Tailrace avian wire arrays at The Dalles and John Day dams • Spillway flow deflectors at John Day (spillbay 20) and Little Goose (spillbays 1 and 8) dams • Extended-length spillwall at The Dalles Dam • Conversion of the Bonneville Dam Powerhouse I ice and trash sluiceway to a surface passage route • Spillway weirs at John Day, McNary, Lower Monumental, and Little Goose dams 7
Implementation of 2008/10/14 BiOpConfiguration Improvements Bonneville MGR Lower Granite Spillway Weir Lower Monumental Spillway Weir Lower Monumental Juvenile Bypass Outfall Relocation The DallesSpillwall McNary Juvenile Bypass Outfall Relocation 8
Yearling Chinook Dam Passage and SurvivalThe DallesDam - Pre vs. Post Spillwall The Dalles Dam – Pre-spillwall (2005)/Post-spillwall (2010)Yearling Chinook SalmonBiOpPerformanceStandard = 96%Overall Dam Survival – 2005 = 93.3%/2010 = 96.4%Target Spill Operation – 40% Turbine passage = 12%/5% Sluiceway passage = 11%/11% Spillway passage = 77%/84% Turbine survival = 84%/88% Sluiceway survival = 100%/99% Spillway survival = 93.8%/97% 9
Surface Passage Characteristics McNary DamSpillway Weirs • Spillway weirs and other surface passage structures provide a surface route of passage and allow fish to pass dams at depths where they naturally migrate • Easier for fish to find; reduce migration delay and minimize exposure to predation near dams • Generally provide the highest survival of all passage routes at dams; consistently at or near 100 percent survival • Pass the most fish relative to the volume of water, making them the most effective passage route • Increase spill passage efficiency (% of fish that pass through spill); as many as 4-times the percent of fish pass the dam through spill bays equipped with spillway weirs • Reduces the number of fish that pass through turbines • Surface passage routes currently exist at all 8 dams 10
Implementation of 2008/10/14 BiOpOperational Improvements • Hydropower Strategy 3 – Implement Spill and Juvenile Transportation Improvements at Columbia and Snake River Dams • Spill operations coupled with configuration improvements completed at each dam are a key component of BiOp implementation to increase fish survival as they migrate through the hydrosystem • 24-hour spill operations occur at all eight dams from early April through August • Planned spring spill operations for 2014-18 are specified below 11
Juvenile Dam Passage SurvivalPerformance Standards • As part of the 2008 BiOp implementation, configuration and operational improvements have been developed and implemented to achieve the juvenile dam passage survival performance standards of 96 percent for spring migrants and 93 percent for summer migrants specified in the BiOp • Spill levels and spill patterns at each dam have been developed and tailored to facilitate juvenile fish passage without hindering adult passage by accounting for the unique characteristics and configuration of each dam • Strategy utilizes spill coupled with surface passage and other structural improvements (such as screened bypass system upgrades) to increase juvenile fish survival • Current spill operations along with existing and planned configuration improvements outlined in the Action Agencies’ Implementation Plan, are expected to help achieve the juvenile dam passage survival performance standards of 96 percent and 93 percent survival at all dams by 2018 • Performance standard testing is underway and expected to be complete by 2018 12
Little Goose Dam Performance Standard TestingYearling Chinook Salmon Spillway Passage 21.1% Spillway Weir Passage 44.2% Turbine Passage 3.8% Bypass Passage 31.0% Spill Survival 94.9% Turbine Survival 87.0% Spillway Weir Survival 100.1% Bypass Survival 98.8% Little Goose Dam 2012Yearling Chinook SalmonBiOpPerformanceStandard = 96%Overall Dam Survival = 98.2%Spill Operation (Target/Actual) = 30.0%/31.8% 13
Recent Passage and Survival EstimatesAcquired From Performance Standard Testing 14
Juvenile Fish Travel TimeThrough the FCRPS Lower Granite to Bonneville Dam Fish Migration Travel TimeUnder 3 Flow Conditions (low, moderate, high) (~2004-2009*) 16 SOURCE: Muir, W.D., Williams, J.G. 2012. Improving connectivity between freshwater and marine environments for salmon migrating through the lower Snake and Columbia River hydropower system. Ecol. Eng. 48: 19-24
In-river Juvenile Fish SurvivalPre-BiOp vs. Post-BiOp Pre-BiOp period: 1997 – 2007 Post-BiOp period: 2008 – 2012 17
Wild adult fish abundance is increasing • Based on 10 years of data, 2002 – 2011: • On average, wild Chinook salmon populations have more than tripled in abundance. • On average, wild steelhead populations have more than doubled in abundance. Note: Based on comparison of geometric mean of abundance from 1990-1999 to most recent 10 years, generally 2002-2011. 18
Status of wild adult fish Of the 49 Interior Columbia Basin wild adult fish populations where data are available, 47 have increased in abundance since listings in the 1990s. 19
Summary: Hydro results are ongoing and promising • Research-based improvements are delivering improved passage, higher in-river survival and faster fish travel time. • Spill volumes and spill patterns are tailored to conditions at each dam, enhancing spill effectiveness. • Improvements and testing are ongoing and still proving their value to the region. • As of 2010, all mainstem dams have been equipped with a surface passage route…It is too early to change course from this current performance-based approach. 20
Proposed Spill Test • Implementing voluntary spill levels greater than historical levels, particularly in lower flow years. Implementation is proposed to include these facets: • What: Increase spill to 125% of total dissolved gas level or biological constraints. As 125% total dissolved gas exceeds water quality criterion, criteria modifications through regulatory processes are required. • When: During spring operations (3 April through 20 June) for a period of 10 years with a comprehensive assessment after 5 years. • Where: At federal Lower Snake and Lower Columbia River Hydroelectric projects -- Lower Granite, Little Goose, Lower Monumental, Ice Harbor, McNary, John Day, The Dalles and Bonneville dams. • Utilizing the Comparative Survival Studies (CSS) PIT-tag monitoring framework. • Monitoring Smolt-to-Adult survival rates. • Comparing survival rates against both past survival rates and prospective model predictions. • Evaluating whether empirical observations are consistent with the predicted benefits of higher voluntary spill levels. • Inclusion of sideboards or “off-ramps”…
Confounding factors make SARS a difficult metric to guide hydrosystem modifications • Hydro performance is more appropriately measured by: • Juvenile dam survival which is a direct measure of hydro performance and therefore more appropriate than SARS. • Total in-river and reach survival (e.g. Lower Granite to Bonneville) of juveniles and adults also provide a measure of hydro performance. • Dam operators cannot control or influence the vast majority of the factors that affect adult fish returns. • Approximately 60% of the environmental factors influencing Chinook returns to Bonneville Dam are related to large scale ocean/atmospheric conditions, and ocean growth/feeding. (Burke et al. 2013) • So many factors affect SARS that tests comparing different spill conditions may require several decades to show a statistically reliable effect on SARS. • Current rigorous survival performance standard testing at the dams and in-river survival monitoring produce reliable results on smolt survival each year. 23
Ocean conditions, not spill levels, have the greatest influence on adult returns Pacific Decadal Oscillation (PDO), May - September 24 Source: Burke et al. (2013)
Similar trends for transported and in-river fish suggest larger factors driving SARS • The SARs of transported fish have similar relationships to spill as their in-river counterparts even though the transported fish did not experience spill. This demonstrates that other factors, besides spill, are affecting SARs of both groups. In 2008, 2009, and 2010 Chinook SARS were similar for transported and in-river fish. Mean % Spill Even though the mean % spill was high in 2010, Chinook SARS were low for both transported and in-river fish. 25 Source: 2012 CSS Annual Report
CSS assumptions underlying the proposed high spill test are oversimplified • Dam survival and passage condition data do not reflect recent advancements in the federal spill program • CSS does not consider 10+ years of cumulative route-specific acoustic tag information from BiOp juvenile performance standard and survival testing for each dam • Dam specific biological and structural constraints, including total dissolved gas constraints, are not included, making the results incomplete. • Results are extrapolated beyond the range of empirical data thus assuming that if some spill improves survival then more spill will provide further increases proportionate to volume. 26
Statistical Design & Analysis Considerations Regarding a Proposed Spill Study John R. Skalski University of Washington 27
Properties of Scientific Experiments Fisher (1947) Cox (1958) Elimination of confounding factors Precision Useful range of validity Simplicity Ability to estimate error variance 28 Replication Randomization Error control Treatment contrasts
Proposed “Spill Experiment” Fisher (1947) Criteria • Replication: 10 consecutive years • Randomization: None • Error control: Whatever nature presents • No control for ocean effects • No control for fish health, size, etc. • No control for harvest changes • Treatment contrasts: None • Single spill level, year after year 29
Proposed “Spill Experiment” Cox (1958) Criteria • Elimination of confounding factors • Confounding with time appears problematic • Precision • No reference to sample sizes, precision, or statistical power • Useful range of validity • Only one spill level evaluated • Simplicity • Current proposal is too simplified • Ability to estimate an error variance • No hypothesis to formally test 30
Other Study Considerations • No formal selection of response variable(s) • Choice will influence how success or failure is measured • Need a priori prioritization of response variables to measure success 31
Other Study Considerations (Cont.) • No formal tests of hypotheses • Possible candidates mentioned: • Test of Means Difficulties • Confounded with time • No error control – very noisy 32
Other Study Considerations (Cont.) • Time Series Analysis Ho: Time series stationary Ha: Shift in response after intervention Ha Ho Before Test Time 33
Other Study Considerations (Cont.) Difficulties • 5 or 10 years are not long for time series • Paulsen & Hinrichsen (2002) found time series half as powerful as treatment contrasts • Currently system not stationary • 6/7 ESUs have upward trends • Time Series Analysis (cont.) 34 From: USACE, USBR, BPA. 2013. Citizen’s Guide to the 2013 Comprehensive Evaluation.
Other Study Considerations (Cont.) 45o • Observed vs. Modeled Predictions OBS PRED Before After 45o OBS PRED 35
Other Study Considerations (Cont.) • Observed vs. Modeled Predictions (cont.) Difficulties • Model must be selected a priori • Predictive model needs to be reasonably accurate (i.e., unbiased) and precise • Predictive model must be calibrated beyond current range of spill • Currently, predictions of adult returns fairly poor 36
Other Study Considerations (Cont.) • No power calculations/No sample size calculations • Calculations not possible without formal tests of hypotheses • No justification for 10-year study • No specification of within-year tagging effort • No specification of the size of that is reasonable to expect and detect under proposed spill plan • Haeseker et al. (2012) suggested • SARS : 4 – 8 times larger • Inriver survival: +0.30 37
UW Power Calculations • SARs • Two orders of magnitude of interannual variation • Need century of observations • TIRs • Transports control for fish condition, ocean, harvest effects • Vary by factor of 5 or less • Still need multiple decades 38
UW Power Calculations (cont.) 39 = 0.10, one-tailed test
Other Study Considerations (Cont.) • No ancillary studies of extraneous effects • Monitoring for change in smolt condition or size that could confound study • Monitoring for increased incidence of gas bubble disease under 125% TDG • Monitoring for changes in adult migration • No trigger to stop study if problems occur 40
Other Study Considerations (Cont.) • No decision rules • Plan specifies comprehensive testing in 5 and 10 years • No sequential testing proposed • No decision rules to continue or stop study 41
Conclusions • Numerous design and analysis considerations central to the success of a spill study have not been fully specified • A priori specifications of response variables and tests of hypotheses essential for an objective evaluation • Preliminary calculations suggest inriver survival will need to increase substantially (i.e., ) for study to have moderate to reasonable power in 10 years • A formal, peer-reviewed design and analysis plan must be developed prior to the investigation 42
Action Agency Conclusions:Best available science supports existing path forward • The federal agencies just completed a 5-year comprehensive evaluation of our ten-year program, with very good results and measurable metrics for accomplishments, such as: • Juvenile Performance Standards • In-river passage and reach survival of juveniles and adults, including adult abundance • This program of research-based improvements and rigorous testing is demonstrating positive results and should be completed as planned • The proposed spill test uses a 2-6% target for Smolt-to-Adult Returns (SARS) as measure of success, but SARS reflect more than hydro system impacts. • The proposal relies on the CSS model, which is based on oversimplified correlations between juvenile survival and SARS with averaged environmental indices (spill %, flow, etc). ISAB’s annual review advised further refinement of the model. • Outstanding science questions remain about impacts of higher spill, the rationale for the proposed test, and latent mortality. 43