Download
1 / 14
140 likes | 275 Views
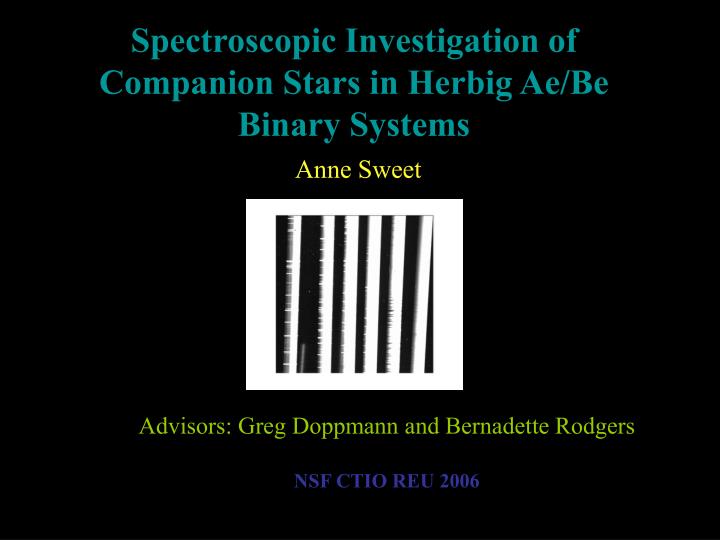
Advisors: Greg Doppmann and Bernadette Rodgers NSF CTIO REU 2006. Spectroscopic Investigation of Companion Stars in Herbig Ae/Be Binary Systems Anne Sweet. Introduction:. What are Herbig AeBe Stars? -Pre-Main Sequence (PMS) - 2 < Msun < 8 -associated with a star forming regions

E N D
Advisors: Greg Doppmann and Bernadette Rodgers NSF CTIO REU 2006 Spectroscopic Investigation of Companion Stars in Herbig Ae/Be Binary SystemsAnne Sweet
Introduction: What are Herbig AeBe Stars? -Pre-Main Sequence (PMS) - 2 < Msun < 8 -associated with a star forming regions -IR excess and/or emission lines Why are we studying these systems? -binary fraction and the initial mass function -possibility of direct mass measurement -stellar evolution as a function of mass -the effects of PMS Herbig stars on the evolution of low mass counterparts --> HR diagram Why are we using the IR? -environments associated with Young Stellar Objects (YSOs) make the IR the most effective and ideal waveband
Data: Sample Selection -Herbig stars with known companions and a binary separation of less than 0.8'' Observations -MK Standards: GNIRS 111 1/mm grating, R =18,000 -CO Ori A and B: 32 1/mm grating, R=1,800 -HR 5999B: GNIRS 111 1/mm grating, R =18,000 -BF Ori B: GNIRS 111 1/mm grating, R =6,000 Reductions -images reduced in IRAF -telluric correction applied using xtellcor in IDL
Spectral Analysis: Two methods used, both utilizing the Ames models (Hauschildt 2003-private communication) 1) High Resolution Analysis (R=18,000) -matches spectral synthesis models with data to find the best pixel to pixel fit across absorption lines (Na lines at 2.2 microns, CO bandhead at 2.3 microns) -used with: MK standards, HR5999B (Na only), BF Ori B (Na only) 2) Medium Resolution Analysis (R=6,000) -overplots models on data for a qualitative eye fit -uses equivalent widths of models and data for a quantitative comparison. -used with CO Ori A and B and BF Ori B. For both methods, data must be late type!
High Resolution Analysis: Fitting Line Shapes -Using Na and CO portions of the spectra. -Process (Doppmann 2003): -input .txt file -select relevant region -input a specific value for log(g), and give a range of values for vsini, shift and Teff. -iterate to minimize RMS
High Resolution Analysis: Standards -8 standards, K0-M0.5, luminosity class III -used for calibrating technique to literature -well correlated, but systematically offset from published data -other models were considered, but discarded due to limited atmospheres.
High Resolution Analysis: BF Ori B -R=6,000 data -We applied two fits with different fixed logg values for a decent result- useful for comparison with medium resolution result.
Medium Resolution: Fitting Line Strengths -Program overplots models on data for a qualitative fit comparison -with the generated models, measure equivalent widths of strong lines and compare to equivalent widths of data. -Na lines of BF Ori B shown on left, note changes in lines with increasing temp.
Medium Resolution Analysis: equivalent widths 10 strong lines chosen across 5 different orders (Na, Ti, Al)
Medium Resolution: BF Ori B EQW analysis - Green: Logg=3.5, Blue: Logg=4.5, red: EQW of data with errors
Conclusions: -put these results on an H-R diagram!! -by identifying spectral type, identify how many are late-type and compare to the T Tauri stars (PMS without nearby Herbig star) to say something about the effect that a massive star has on low mass stellar formation. -Questions this brings up....
Thanks to: -Greg and Bernadette for being fantastic mentors (and Peter for always trying to give me the day off) -Stella, best REU mom EVER -the other REUers for breaking the harassment/decency code JUST about every day. -NSF for this wonderful research opportunity!!