Download
1 / 49
510 likes | 691 Views
What is Population Ecology ?. Ecology is. the study of interactions among organisms with each other and with their environment. Ecology studies these interactions at different levels, called levels of organization . So....Population Ecology is.

E N D
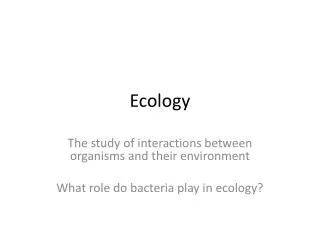
Ecology is... • the study of interactions among organisms with each other and with their environment
Ecology studies these interactions at different levels, called levels of organization.
So....Population Ecology is • the study of how the population sizes of species living together in groups change over time and space
Population Characteristics • There are three characteristics that all populations have: • population density, • spatial distribution, • and growth rate.
1. Population Density • Refers to the number of individuals in relation to the space Population Density =
1. Population Density • Example: What is the density of a rabbit population of 200 living in a 5 km2 range? • Solution: Population Density =
1. Population Density • Example: What is the density of a rabbit population of 200 living in a 5 km2 range? • Solution: Population Density = Population Density =
1. Population Density • Example: What is the density of a rabbit population of 200 living in a 5 km2 range? • Solution: Population Density = Population Density = Population Density = 40 rabbits / km2
1. Population Density • Density – dependent factors – factors that can affect a population growth because of its density. E.g. Food supply, competition for mates, spread of disease. • Density- independent factors – factors that can affect a population growth regardless of its density. E.g. Forest fires, Flood, Habitat destruction, Pollution
2. Spatial Distribution • Refers to the pattern of spacing of a population within an area • 3 types: clumped, uniformly spaced, and random
2. Spatial Distribution • Results from dispersion – the spreading of organisms from one area to another Three types of barriers prevent dispersal: • Physical barriers (e.g. mountains, oceans) • Ecological barriers (e.g. grassland animals do not move into forests) • Behavioural barriers (e.g. birds that prefer tall trees over short trees will not disperse into short trees)
3. Growth Rate • Refers to how fast a population grows 4 factors determine how a population changes: • Natality (birth rate) • Mortality (death rate) • Immigration (individuals moving into a population) • Emigration (individuals moving out of a population)
3. Growth Rate • Population change can be calculated as: Birth rate – death rate + immigration - emigration
3. Growth Rate • Example: In a given year, a pack of timber wolves experiences the birth of 3 pups and the death of a lone wolf. No animals moved into the pack but 1 wolf did leave. • Solution: Birth rate – death rate + immigration - emigration
3. Growth Rate • Example: In a given year, a pack of timber wolves experiences the birth of 3 pups and the death of a lone wolf. No animals moved into the pack but 1 wolf did leave. • Solution: Birth rate – death rate + immigration - emigration = 3 – 1 + 0 – 1
3. Growth Rate • Example: In a given year, a pack of timber wolves experiences the birth of 3 pups and the death of a lone wolf. No animals moved into the pack but 1 wolf did leave. • Solution: Birth rate – death rate + immigration - emigration = 3 – 1 + 0 – 1 = 1 Meaning that in this year, the wolf pack experienced a growth of 1 wolf.
Population Sampling Methods • When the number of organisms in a population is hard to count, scientists estimate the total population size • They do this by first sampling the population and then calculating a population size based on the data • There are 3 methods: Mark-Recapture, Quadrat, and Random Sampling
1. Mark-Recapture Sampling • Also called ‘tagging’ • A sample of organisms is captured and marked and then returned unharmed to their environment • Over time, the organisms are recaptured and data is collected on how many are captured with marks
1. Mark-Recapture Sampling Example: In order to estimate the population of sturgeon fish in the river, biologists marked 10 sturgeon fish and released them back into the river. The next year, 15 sturgeon were trapped and 3 were found to have marks.
1. Mark-Recapture Sampling Example: In order to estimate the population of sturgeon fish in the river, biologists marked 10 sturgeon fish and released them back into the river. The next year, 15 sturgeon were trapped and 3 were found to have marks.
1. Mark-Recapture Sampling Example: In order to estimate the population of sturgeon fish in the river, biologists marked 10 sturgeon fish and released them back into the river. The next year, 15 sturgeon were trapped and 3 were found to have marks.
1. Mark-Recapture Sampling Example: In order to estimate the population of sturgeon fish in the river, biologists marked 10 sturgeon fish and released them back into the river. The next year, 15 sturgeon were trapped and 3 were found to have marks.
1. Mark-Recapture Sampling • Best for mobile populations, such as fish and birds • Problems occur when no marked organisms are captured
2. Quadrat Sampling • A sampling frame (quadrat, usually 1m2) is used to count the individuals in a mathematical area • Population size is then estimated based on the data from the quadrat
2. Quadrat Sampling Example: A biologist counts 13 mushrooms in a 1m x 1m quadrat. The area of study is 12m2.
2. Quadrat Sampling Example: A biologist counts 13 mushrooms in a 1m x 1m quadrat. The area of study is 12m2.
2. Quadrat Sampling Example: A biologist counts 13 mushrooms in a 1m x 1m quadrat. The area of study is 12m2.
2. Quadrat Sampling Example: A biologist counts 13 mushrooms in a 1m x 1m quadrat. The area of study is 12m2.
Quadrat Sampling • Best for small stationary populations, such as plants & mushrooms • Problems occur when the quadrats are placed in ‘abnormal’ locations
3. Random Sampling • The number of organisms within a small area (plot) is counted. • The plots are often placed randomly throughout the sampling area • Population size and density are then estimated based on the plot representation.
3. Random Sampling • Find the average # of individuals in the areas you sampled.
3. Random Sampling • Find the average # of individuals in the areas you sampled. • Multiply the average by the # of plots to find the population estimate
3. Random Sampling Example: A sample was taken to count the number of silver maple trees in the forest. The number of trees counted in the grid is shown below.
3. Random Sampling per plot Example: A sample was taken to count the number of silver maple trees in the forest. The number of trees counted in the grid is shown below. 1.
3. Random Sampling per plot Example: A sample was taken to count the number of silver maple trees in the forest. The number of trees counted in the grid is shown below. 1.
3. Random Sampling per plot Example: A sample was taken to count the number of silver maple trees in the forest. The number of trees counted in the grid is shown below. 1.
3. Random Sampling per plot Example: A sample was taken to count the number of silver maple trees in the forest. The number of trees counted in the grid is shown below. 2.
3. Random Sampling per plot Example: A sample was taken to count the number of silver maple trees in the forest. The number of trees counted in the grid is shown below. 2.
3. Random Sampling per plot Example: A sample was taken to count the number of silver maple trees in the forest. The number of trees counted in the grid is shown below. 2.
3. Random Sampling • Best for large stationary populations, such as trees or coral • Problems occur when random sampling is not followed