Download
1 / 37
470 likes | 975 Views
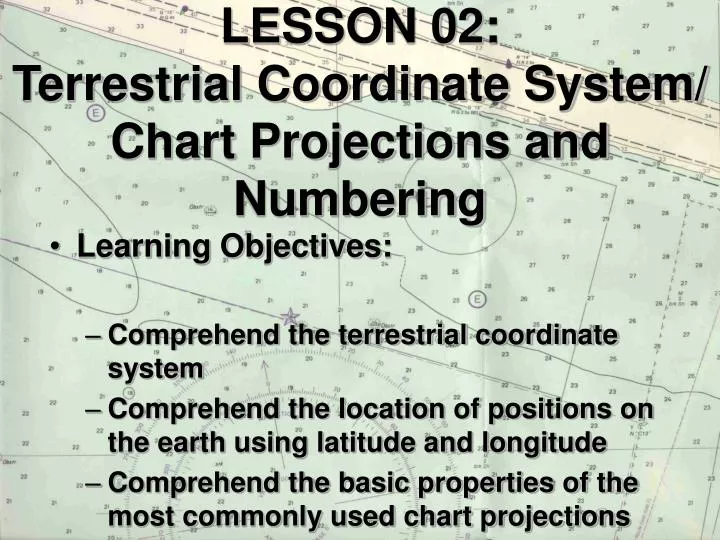
LESSON 02: Terrestrial Coordinate System/ Chart Projections and Numbering. Learning Objectives: Comprehend the terrestrial coordinate system Comprehend the location of positions on the earth using latitude and longitude

E N D
LESSON 02:Terrestrial Coordinate System/ Chart Projections and Numbering • Learning Objectives: • Comprehend the terrestrial coordinate system • Comprehend the location of positions on the earth using latitude and longitude • Comprehend the basic properties of the most commonly used chart projections
Terrestrial Coordinate System • The earth is an oblate spheroid, but for navigational purposes it is considered a perfect sphere with a circumference of 21,600 NM. • On a perfect sphere at rest, all points on the surface are similar; reference points must be designated in order to make any type of measurements.
Terrestrial Coordinate System • When rotation is introduced, the spin axis introduces two reference points, the north and south poles. • The spin axis of the earth, together with its poles, constitutes the basic reference points on which the terrestrial coordinate system is based.
Terrestrial Coordinate System • Great Circle: the intersection of a plane passing through two points on the surface of the earth and the center of the earth. • Some key points: • A great circle is the largest circle that can be drawn on the face of the earth. • A great circle represents the shortest distance between two points on the surface of the earth.
Terrestrial Coordinate System • Equator • Meridian
Terrestrial Coordinate System • Small Circle- any circle not passing through the center of the earth.
Terrestrial Coordinate System • Meridians of longitude are great circles • Parallels of latitude are small circles (with the exception of the equator)
Latitude and Longitude • The equator divides the earth into the northern and southern hemispheres and is the reference for parallels of latitude. • The prime meridian passes through the original position of the Royal Greenwich Observatory. It serves as the reference for meridians of longitude.
Latitude and Longitude • Meridians are divided in half: • upper branch • lower branch • Prime Meridian • upper branch is known as the Greenwich meridian • lower branch is the 180th meridian
Longitude Defined • The angular distance between the Greenwich meridian and the meridian passing through a particular point on the earth’s surface. Longitude is measured in degrees of arc from 0 to 180 degrees, either east or west.
Latitude Defined • The angular distance between the Equator and the parallel passing through a particular point on the earth’s surface. Latitude is measured in degrees of arc from 0 to 90 degrees, either north or south.
Measurement of Distance • Since latitude lines are parallel, the length of one degree of latitude is the same everywhere on earth (60 NM). • As the distance from the equator increases, the length in miles of one degree of longitude decreases, so NEVER use the longitude scale to determine distances on a chart.
Chart Projections • Desirable qualities of a chart projection: • Correct angular relationships • Representation of areas in their correct proportions relative to one another • True scale • Rhumb lines represented as straight lines. Note: Rhumb lines are lines on the surface of the earth that cross all meridians at the same angle. Ships on a constant course follow rhumb lines. • Great circles represented as straight lines
Mercator Projection • Imagine a cylinder rolled around the earth, tangent at the equator, and parallel to the earth’s axis. • Meridians appear as straight vertical lines when projected outward onto the cylinder.
Advantages Position, Distance, and direction easily determined. True shape of features is maintained for small areas (conformality) Rhumb lines plot as straight lines. Disadvantages Distortion of true size of surface features increases with distance from the equator. Great circles appear as curved lines. Mercator Projection
Gnomonic Projection • Surface features and reference lines on the earth’s surface are projected outward from the center of the earth onto a tangent plane. • Three basic types, depending on point of tangency: • equatorial gnomonic (tangent at equator) • polar gnomonic (tangent at either pole) • oblique gnomonic (tangent somewhere else)
Advantages Great circles appear as straight lines (shortest distance between two points) Tolerable distortion within 1000 miles of the point of tangency Disadvantages Rhumb lines appear as curved lines Distance and direction cannot be measured directly Not conformal (true shapes are not presented) Gnomonic Projection
Gnomonic Since great circles appear as straight lines, used to determine the shortest route between two points. This information is then transferred to a Mercator chart. Mercator Used for everyday navigation, due to the ease of measurement of position, distance, and direction. Gnomonic vs. Mercator
Nautical Charts • Two government activities are responsible for producing charts: • Defense Mapping Agency (DMA) • ocean areas of the world outside U.S. territorial waters • National Ocean Service (NOS) • inland and coastal waters of the U.S. and its possessions
All charts are assigned a 1 to 5 digit number, depending on the scale of the chart No. of digitsScale 1 no scale (supporting publications) 2 1:9,000,001 and smaller 3 1:2,000,001 to 1:9,000,001 4 misc and special non-nav charts 5 1:2,000,000 and larger Chart Numbering System
Chart Numbering System • 1 Digit: supporting publications • 2 or 3 Digits: depict large ocean basins and subdivisions. First digit is the ocean basin (there are nine worldwide).
Chart Numbering System • 5 Digits: are of suitable scale to depict coastal regions with the great detail necessary for piloting. • There are nine coastal regions in the world • Each is divided into several subregions • The first number is the region • The second number is the subregion • The last three numbers represent the geographic sequence of the chart
Chart Numbering System • Thus, the chart numbering system • indicates the scale of the chart (by the number of digits in the chart number) • indicates the area of the world depicted (ocean basin, subdivision, coastal region, and subregion) • enables the navigator to organize the charts into portfolios
Chart Scale • An important point to remember: SMALL SCALE = LARGE AREA LARGE SCALE = SMALL AREA
Chart and Publication Correction System • Navigation is constantly changing! • It is not practical to constantly reprint navigational charts and publications. • DMA and NOS disseminate corrections using two publications: • Notice to Mariners (DMA, worldwide coverage) • Local Notice to Mariners (USCG, changes pertaining to U.S. inland waters)
Chart and Publication Correction System • Corrections must be made by hand to the affected chart or publication. • Fortunately, not all changes are made. The corrections are kept on file, using a correction card for each chart. • Changes are then entered on a chart when a ship is scheduled to operate in the area the chart covers.
Chart and Publication Correction System • Semiannually, DMA publishes a five volume summary of all corrections for the previous six months.
Other Correction Resources • Broadcast Notice to Mariners • Worldwide Navigation Warning System (NAVAREAS) • HYDROLANTS and HYDROPACS • DMA Daily Memoranda • Special Warnings (USN or USCG) • Automated Notice to Mariners System (ANMS)