Download
1 / 24
240 likes | 354 Views
55+ Population in Indiana. 2000: 1 IN 5. 2030: 1 IN 3 . Not a personal problem, but a community challenge. Indiana NNORC’s (naturally occurring retirement communities) South Bend Gary Indianapolis Linton Huntington. AdvantAge Initiative Survey Conducted in: . 10 pilot communities:

E N D
55+ Population in Indiana 2000: 1 IN 5 2030: 1 IN 3
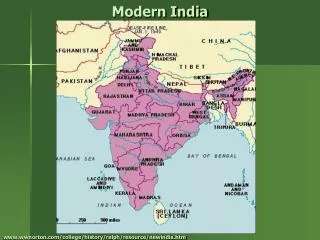
Indiana NNORC’s • (naturally occurring retirement communities) • South Bend • Gary • Indianapolis • Linton • Huntington
AdvantAge Initiative Survey Conducted in: 10 pilot communities: • Six neighborhoods of Chicago, IL • Indianapolis, IN • Jacksonville, FL • Lincoln Square, NYC • Maricopa County, AZ • Orange County, FL • Puyallup, WA • Santa Clarita, CA • Upper West Side, NYC • Yonkers, NY • National Survey • Grand Rapids, MI • Contra Costa County, CA • Parsippany, NJ • Newaygo County, MI • State of Indiana • El Paso County, TX • Chinatown, NY • 14 grantee-communities of the Robert Wood Johnson Foundation Community Partnerships for Older Adults program (CPOA)
Figure 2.1, Indiana§ Percentage of people age 60+ who want to remain in their current residence and are confident they will be able to afford to do so Not Very Confident** 39% Disagree 5% Agree* 94% Neither/ DK/RF 1% Very Confident 61% Unweighted N=4,272 Weighted N=918,078 Unweighted N=4,509 Weighted N=973,489 We asked respondents whether they agree or disagree with the following statement: “What I’d really like to do is stay in my current residence for as long as possible.” For people who answered “agree” we calculated the percentage of adults age 60+ who were very confident/not very confident that they will be able to afford to live in their current residence for as long as they would like. Note: Percentages may not add up to 100% due to rounding and/or missing information. *Agree includes those who said Strongly agree or Somewhat agree. **Not Very Confident includes those who said Somewhat confident, Not too confident, Not confident at all, Don’t know, or Refused. § Excludes Area 2 (Elkhart, Kosciusko, LaPorte, Marshall & St. Joseph Counties) which was surveyed in 2006. Source: AdvantAge Initiative Community Survey in Indiana 2008
A rebalanced system • Bring 14,500 people out of institutional care and into home and community based care • Save Indiana $800 million. Lessons from Home: Applied, http://www.generationsproject.org/
Aging is not about time and the bodybutabout place and relationships.
“Community is the smallest unit of health.” Wendell Berry,Health is Membership InAnother Turn of the Crank
Figure 24.1, Indiana§ Percentage of people age 60+ with adequate assistance* in instrumental activities of daily living (IADL) 1 or more unmet need 5.4% All needs are met 6.1% 1+IADL 11.5% 6,000 older Hoosiers No limitations 88.5% Unweighted N=4,509 Weighted N=973,489 Note: Percentages may not add up to 100% due to rounding and/or missing information. *People were asked whether they need assistance with the following activities (IADLs): going outside the home, doing light housework, preparing meals, driving a car/using public transportation, taking the right amount of prescribed medication, keeping track of money and bills. Those who answered “yes” were asked whether they get enough assistance with these activities. § Excludes Area 2 (Elkhart, Kosciusko, LaPorte, Marshall & St. Joseph Counties) which was surveyed in 2006. Source: AdvantAge Initiative Community Survey in Indiana 2008
Figure 31.1, Indiana§ Percentage of people age 60+ who participate in volunteer work* 380,000 older Hoosiers Participate in volunteer work 39% DK/RF <1% ‡ Do not participate in volunteer work 61% Unweighted N=4,509 Weighted N=973,489 Note: Percentages may not add up to 100% due to rounding and/or missing information. *People were asked if they do volunteer work and if so what type of volunteer work they do. ‡ This percentage is based on fewer than 20 respondents (Unweighted N<20) and should be interpreted with caution. § Excludes Area 2 (Elkhart, Kosciusko, LaPorte, Marshall & St. Joseph Counties) which was surveyed in 2006. Source: AdvantAge Initiative Community Survey in Indiana 2008
Figure 25.1, Indiana§ Percentage of people age 60+ who provide help to the frail or disabled* 214,000 older Hoosiers DK/RF <1% Provide care 22% ‡ Do not provide care 77% Unweighted N=4,509 Weighted N=973,489 Note: Percentages may not add up to 100% due to rounding and/or missing information. *People were asked whether they provide help or care, or arrange for help or care, for a relative or friend who is unable to do some things for him/herself due to illness or disability. ‡ This percentage is based on fewer than 20 respondents (Unweighted N<20) and should be interpreted with caution. § Excludes Area 2 (Elkhart, Kosciusko, LaPorte, Marshall & St. Joseph Counties) which was surveyed in 2006. Source: AdvantAge Initiative Community Survey in Indiana 2008
Figure 33.1, Indiana§ Percentage of people age 60+ who would like to be working for pay* DK/RF 2% 163,000 older Hoosiers 23% Would like to work for pay Working part time 13% Not working 73% Working full time 14% Would not like to work for pay 75% DK/RF <1% ‡ Unweighted N=4,509 Weighted N=973,489 Unweighted N=3,254 Weighted N=708,611 *People were asked what their current employment status is. *People who were not working were asked whether they would like to be working for pay. Note: Percentages may not add up to 100% due to rounding and/or missing information. ‡ This percentage is based on fewer than 20 respondents (Unweighted N<20) and should be interpreted with caution. § Excludes Area 2 (Elkhart, Kosciusko, LaPorte, Marshall & St. Joseph Counties) which was surveyed in 2006. Source: AdvantAge Initiative Community Survey in Indiana 2008
Active and Contributing! • 85% voted in last election • 37% contacted an elected representative • 89% made donation of goods or services to charity • 7% live with grandchildren • 81% report good to excellent health
“Our enormous and rapidly growing older population is a vast, untapped social resource. It we can engage these individuals in ways that fill urgent gaps in our society, the result will be a windfall for American civic life in the twenty-first century.” Marc Freedman
Housing • Transportation • Health Care • Education • Land Use Planning • Faith Community
S1619 The Livable Communities ActCreating Better and More Affordable Places to Live, Work, and Raise Families And good places to grow old… Incentives to Plan for Livable Communities Funding to Implement Sustainable Development Plans
ACTION RESOURCES PARTICIPATION COMMUNITIES TRANSFORMED DATA
“Improving a community, from beginning to end, involves organizing people. Money is secondary.”
“Old people everywhere.” Christopher Alexander A Pattern Language
Contact information • Philip B. Stafford, Ph.D. • Director, Center on Aging and Community, Indiana Institute on Disability & Community • 2853 East Tenth, Bloomington, IN, 47408 • (812) 855-2163 • staffor@indiana.edu • www.agingindiana.org