Download
1 / 46
460 likes | 465 Views
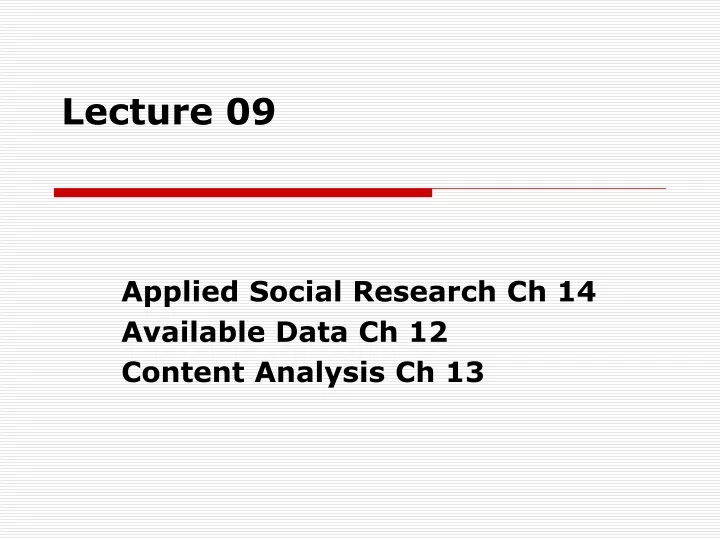
Lecture 09. Applied Social Research Ch 14 Available Data Ch 12 Content Analysis Ch 13. Uses of SOCIAL RESEARCH. Applied Research Explanatory Research Critical Research Exploratory Research Descriptive Research. 100.

E N D
Lecture 09 Applied Social Research Ch 14 Available Data Ch 12 Content Analysis Ch 13
Uses of SOCIAL RESEARCH Applied Research Explanatory Research Critical Research Exploratory Research Descriptive Research 100 • Exploratory Research Ground-breaking research on a relatively unstudied topic or in a new area • Descriptive Research Research designed to describe groups, activities, situations or events with a focus on structure, attitudes or behavior “how the land lies” • Explanatory Research Research that seeks to explain the cause of a phenomenon, and typically asks a “What causes what?” or “Why is it this way?” research question • Critical Research Research with the goal of critically assessing some aspect of the social world • Applied Research Research intended to be useful in the immediate future and to suggest action or increase effectiveness in some area (eg evaluation or participatory action research) • A research project can have more than one purpose. 200 300 400 500
Most Social Research balances applied and basic research • Applied Research is research with a practical purpose and helps to create, modify, and implement programs and activities that make a difference in people’s lives http://iar.csusb.edu/ http://www.buzzle.com/articles/difference-between-basic-and-applied-research.html
Database Links to study networks-Research May Give Potential Homicide Victims A Heads Up One tool researchers have used to identify high-risk group members is social network analysis (SNA). Yale sociologistAndrew Papachristos has developed a mathematical method to identify the structures of street groups using connections contained within police records of arrests, field stops, and similar data. SNA recognizes that the overwhelming majority of suspects and victims in homicides and shootings know one another. In fact, Papachristos has demonstrated that they are often part of a closely linked social network — that is, shooters and victims tend to be closely linked to many other shooters and victims. Research on these social networks has found that individuals with links to street groups and those closely linked to homicide victims are at elevated risk of becoming shooters or victims themselves. SNA has helped communities identify group members to notify. Using co-arrest and field stop records, SNA can create graphs of connections between street group members. A GVI partnership can use these maps to identify “brokers” — people with a profusion of group-related connections — and people closely connected to homicide victims and suspects. These high-risk group members can then be given custom notifications to give the city’s antiviolence message the greatest reach and to disrupt street group networks. http://www.npr.org/2014/10/09/354754588/research-may-give-potential-homicide-victims-a-heads-up http://nnscommunities.org/our-work/innovation/social-network-analysis
The Policy Cycle http://iar.csusb.edu/ http://trochim.human.cornell.edu/kb/pecycle.htm
To document a social problem we can gather data from multiple sources: • Primary data is original data collected by the researcher • Secondary data is collected by someone other than the researcher • Has been the dominant mode of social science research in the twentieth century. http://www.westernseminary.edu/transformedblog/2011/12/05/problem-4-the-unsocial-gospel/ • A major advantage of using available data is that data are usually cheap and convenient. • Usable secondary data can be found by doing a literature review or by searching the Internet. http://trochim.human.cornell.edu/kb/pecycle.htm
To document a social problem we can gather data from multiple sources: • Primary data is original data collected by the researcher • Secondary data is collected by someone other than the researcher • Has been the dominant mode of social science research in the twentieth century. Look Familiar? http://www.westernseminary.edu/transformedblog/2011/12/05/problem-4-the-unsocial-gospel/ http://sda.berkeley.edu/ • A major advantage of using available data is that data are usually cheap and convenient. • Usable secondary data can be found by doing a literature review or by searching the Internet.
Look Familiar? • Data come in all sorts of formats… • Raw • Half Baked • Fully Cooked • Statistics that have been made into statistical documents are called existing statistics. http://sda.berkeley.edu/ http://www.outsidethebeltway.com/public-acceptance-of-same-sex-marriage-at-all-time-high/
Be cautious to avoid ecological fallacy- misleadingly making inferences about certain types of individuals from information about the groups they belong to, that might not be exclusively comprised of those individuals. • Existing Statistics are statistics provided by large organizations • In general, the unit of analysis in studies based on existing statistics is not the individual. http://www.fbi.gov/about-us/cjis/ucr/crime-in-the-u.s/2013/crime-in-the-u.s.-2013/tables/table-10/table-10-pieces/table_10_offenses_known_to_law_enforcement_by_alabama_by_metropolitan_and_nonmetropolitan_counties_2013.xls
Social Problems (and other areas of interest) can also be documented using Content Analysis- studying available recorded data other than secondary data. • Could collect data from such sources as: • Newspapers • Want ads • Diary entries • Email messages • It doesn’t have to be applied. • Might study such things as: • Women’s portrayal through art • Election coverage on various web sites • Facebook accounts for social activity among teens • Social networks through obituaries http://trochim.human.cornell.edu/kb/pecycle.htm
Units of Analysis are the units about which information is collected and units of observation are the units from which information is collected. Generally, quantitative content analyses tend to be deductive and qualitative content analyses tend to be inductive. https://depts.washington.edu/uwiser/tp_content_analysis.htm • It doesn’t have to be applied. • Might study such things as: • Women’s portrayal through art • Election coverage on various web sites • Facebook accounts for social activity among teens • Social networks through obituaries If you were interested in the difference between commercials during children’s and adult’s TV programs, Units of observation= child’s and adult’s TV programs Units of analysis = commercials attached to those programs
Advantages of Content Analysis • Can be conducted with a relatively small expenditure of time, money, and person power. • Doesn’t require you get everything right the first time • Is unobtrusive http://media.tumblr.com/f8d13397889a2b902cafdde41d5315da/tumblr_inline_mudey3mkH11rkv4z0.jpg
Outcome evaluations usually begin with a question like- What is the reason the program is doing what it is doing? http://iar.csusb.edu/ http://trochim.human.cornell.edu/kb/pecycle.htm
Typically intended to assess the impact of a specific policy or program • If the Independent Variable affects the dependent, this is called a causal hypothesis http://iar.csusb.edu/ IV DV http://www.sciencedirect.com/science?_ob=ArticleURL&_udi=B6V7V-3WR4K4M-8&_user=735929&_handle=B-WA-A-W-AV-MsSAYZW-UUW-AAUDUAADDV-AAUVCEWCDV-YBACCWCBC-AV-U&_fmt=full&_coverDate=06%2F30%2F1999&_rdoc=8&_orig=browse&_srch=%23toc%235852%231999%23999779998%23102970!&_cdi=5852&view=c&_acct=C000040778&_version=1&_urlVersion=0&_userid=735929&md5=6e6b6f92758532f01a88230d7ec29380
Evaluation research: distinguished from basic research by its immediate usefulness and its specific practical implications • By the end of an outcome evaluation researchers should be able to answer questions about the program’s success and ways the program or policy can better serve its target population. Outputs Outcomes • Formative Analysis: • Usually Occurs in the early stages of program development and design • Main purpose of process or implementation studies: provide information about the faithfulness of the program to its original design • Summative Main Purpose: Assessing whether Short, Intermediate, and Log-Term Outcomes are Met http://www.fsg-impact.org/images/upload/From%20Insight%20to%20Action(3).pdf
A Natural Experiment For Policy Analysis- Some Parole Requirements Could Be Increasing The Crime Rate nd David Kirk - he's a sociologist at the University of Texas - he immediately realized that a natural experiment was unfolding. And that's because he studies recidivism. This is the likelihood that people who are released from prison will go back to a life of crime and go back to prison. He's interested in whether recidivism is shaped by whether the people released from prison go back to the neighborhoods they came from. Now, in most parts of the country, people who are released from prison often find their way back to their old neighborhoods. Many states actually require parolees to go back to the counties they came from. Kirk wanted to know whether was possible that going to a different community - can that help you to turn over new leaf. http://www.npr.org/2014/07/08/329731503/some-parole-requirements-could-be-increasing-the-crime-rate
Long Term Outcomes might look like: Source: Adler and Clark 2015:368
http://www.dare-america.com/home/default.asp Drugs Bite • Video Overview of DARE • http://sam.ntpi.spcollege.edu/spjc/view/eventListing.jhtml?eventid=5435&c=13009 IV DV http://www.sciencedirect.com/science?_ob=ArticleURL&_udi=B6V7V-3WR4K4M-8&_user=735929&_handle=B-WA-A-W-AV-MsSAYZW-UUW-AAUDUAADDV-AAUVCEWCDV-YBACCWCBC-AV-U&_fmt=full&_coverDate=06%2F30%2F1999&_rdoc=8&_orig=browse&_srch=%23toc%235852%231999%23999779998%23102970!&_cdi=5852&view=c&_acct=C000040778&_version=1&_urlVersion=0&_userid=735929&md5=6e6b6f92758532f01a88230d7ec29380
http://www.dare-america.com/home/default.asp DARE Evaluation as an Example • Research Question: Is DARE effective? • Possible hypotheses • DARE possible dependent variables • Attitudes towards drugs • knowledge of drugs • drug use (behavior) Independent Variable
http://www.dare-america.com/home/default.asp http://www.dare-america.com/officers/Officers_Training/Defaultfe17.asp?N=Officers_Training&M=24&S=0 A 2002 DARE Evaluation • SAMPLE: • More than 15,000 students from 83 high schools and 122 middle schools in 6 U.S. cities (Detroit, Houston, Los Angeles, Newark, New Orleans and St. Louis) are the sample for this study.
STUDY DESIGN: Experiment • Half of the schools were randomly selected to receive the new DARE program which now begins in 7th grade and is designed to be more interactive. • The students in the other schools will receive the original DARE program or no programs and will be the control groups. • Data will be collected before the program begins in 7th grade and then periodically through the 11th grade.
2 Groups 2 Groups Pretest-Posttest Control Group Experiment Random Assignment
DATA • The variables include students’ knowledge, attitudes, and behaviors. The measures will be answers to questions.
Adler and Clark • Turn to Text Page 408 • Which Dependent Variables would use Chi Square and which Difference of Means t test? • Turn to p.410 and 411 • Notice the charts that show 2 categories percentage using alcohol and other drugs (in last 30 days) Does this look familiar? • Chi- Square for % in a category • Now notice Table 14.1 and figure 14.3 these are comparing ???? • Means or average. Also since it is a continuous variable, can have standard deviations and means.
Drug Use: Lifetime Prevalence Just like a chart made with a Cross-Tab IV: Dare or not DV: Drug use or not
We can see differences but are they significant? • Which type of signif test would we use for an IV and DV with 2 categories each? • Alcohol (Y and N) • Dare (Y and N) Chi-Square
If we re-code things into 2 (or even 3 or 4) categories or if they are naturally that way, we know we use Chi-square to test significance. • But what about age or grade level or # of TV hours watched, these are continuous. How do we test those?
The rule of thumb is, if it makes sense to calculate a mean (average), i.e. if it is a continuous variable, • Then use a comparison of means (Z or t test)
The t-test assesses whether the means of two groups are statistically different from each other. This analysis is appropriate whenever you want to compare the means of two groups, and especially appropriate as the analysis for the posttest-only two-group randomized experimental design. http://www.socialresearchmethods.net/kb/stat_t.htm
This leads us to a very important conclusion: when we are looking at the differences between scores for two groups, we have to judge the difference between their means relative to the spread or variability of their scores. The t-test does just this. http://www.socialresearchmethods.net/kb/stat_t.htm
Hypothesis testing • The chi-square test enabled you to test hypotheses where concepts were measured at the nominal or ordinal level • A difference-of-means test allows you to test hypotheses when your variables are measured at the continuous level (interval or ratio)
Adler and Clark • Also look at p. 410 last sentence, statistical significance. This is what we are doing today, statistical significance for diff of means b/t 2 groups.
Lecture 10 Statistical Analysis Ch 15