Download
1 / 159
1.59k likes | 1.6k Views
10. Other Spectroscopies IR NMR. VIBRATIONAL CHROMOPHORES Any bond can act as a spring which can be described as the balance Between the force due to acceleration and to the restoring force of the spring. Set equal. Need a function which reinvents itself. a is a frequency.

E N D
10. Other Spectroscopies • IR • NMR
VIBRATIONAL CHROMOPHORES Any bond can act as a spring which can be described as the balance Between the force due to acceleration and to the restoring force of the spring Set equal
a is a frequency Natural mechanical frequency The frequency of the oscillation is Related to the bond constant, k, And m, which is a mass term
Example: Calculate double bond band for R-C=O Bond k(Newton/m) Single 500 Double 1000 Triple 1500
For IR usually reported as reciprocal cm The average reported value is 1690-1760
1600 cm-1 What is the predicted frequency of C-O?
Example: Calculate single bond band for R-C-O Bond k(Newton/m) Single 500 Double 1000 Triple 1500
What would Be this frequency? 1600 cm-1 1100 cm-1
Example: Calculate single bond band for R-N-Pb Bond k(Newton/m) Single 500 Double 1000 Triple 1500
800 cm-1 Bonds cm-1 R-N-Pb 800 R-C-O 1100 R-C=O 1600 R-CO=O ? 1600 cm-1 1100 cm-1
Bonds cm-1 R-N-Pb 800 R-C-O 1100 R-C=O 1600 R-CO=O ? Our calculations
We once tried looking for the Pb-N Changes but this region is too far into the “fingerprint region” to get good data Higher charge density = higher frequency
Bonds cm-1 R-N-Pb 800 R-C-O 1100 R-C=O 1600 R-CO=O ? Pb-N bond 424, cm-1 CO=O, 1750cm-1 Pure EDTA, Na What would influence the degree of the frequency shift of CO=O? Hint – who would have a stronger attraction for the electrons on O?
More energy 1750cm-1 Shift in C=O frequency Ionic bonding at C-O; Pulls electrons from C=O, creating bond 1.5 order Covalent type bonding (H) at CO Leaves double bond character at CO=O lead Greater electrostatic attraction
Bond k(Newton/m) Single 500 Double 1000 Triple 1500 Lower reduced mass has higher frequency Higher energy Group Frequency Region What do you observe?
Bond k(Newton/m) Single 500 Double 1000 Triple 1500 “fingerprint” region
Which is which? Can you identify all of them?
http://orgchem.colorado.edu/hndbksupport/specttutor/irchart.htmlhttp://orgchem.colorado.edu/hndbksupport/specttutor/irchart.html
Where is the expected vibrational absorption band for R-C=O? We predicted a band at 1600 cm-1 for R-C=O Is this the only band we should observe?
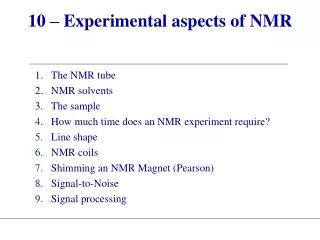
IR bands Observed • Degrees of freedom set total possible bands • Requires a change in dipole moment • Requires a high molar absorptivity • Requires good instrumental “window” • Complicated by passing of overtones Degrees of freedom Bands observed = total DF – (translation + rotational) 3N - ( 3 + (2 or 3)) Possible Bands Linear molecule: 3N-5 Non-linear: 3N-6
O=C=O symmetric stretch • O=C=O asymmetric stretch • O=C=O scissoring • O=C=O scissoring EXAMPLE How many bands should we observe for O=C=O? Linear molecule: 3N-5 = 9-5=4 Each possible band must have a change in dipole moment should not be degenerate Which have a change in dipole Moment? Which are (if any) are degenerate?
EXAMPLE How many bands should we observe for O=C=O? Linear molecule: 3N-5 = 9-5=4 Each possible band must have a change in dipole moment should not be degenerate No dipole moment change • O=C=O symmetric stretch • O=C=O asymmetric stretch • O=C=O scissoring • O=C=O scissoring Degenerate – only one is observed Total of two bands! Animation associated with spectra: http://www.succeedingwithscience.com/labmouse/chemistry_a2/2906.php?LabmouseOnline=191f6382b179f1a28fb4da8c34523817
O O O H H H H H H EXAMPLE How many bands should we observe for H-O-H? Non-Linear molecule: 3N-6 = 9-6=3 Each possible band must have a change in dipole moment should not be degenerate Symmetric stretch Asymmetric stretch scissoring Animation of water vibrations http://www.lsbu.ac.uk/water/vibrat.html
Fused silica Si-O Typical region of IR interest! http://www.laseroptik.de/?Substrates:Transmission_Curves:%26%23150%3B_IR-FS Can not use the quartz materials we were using in UV-Vis
Quartz vibrational bands overlap C-H bonds
Some times we observe more bands than predicted. Why? FT instrument Light that passes at 100 cm-1 will also pass at 200, 300, and 400 cm-1 That means that it could excite absorption at 400 cm-1! 1st order 2nd order 3RD ORDER 4th order Source light cm-1 cm-1 cm-1 cm-1 100 200 300 400 200 400 600 800 300 600 900 1200 400 800 1200 1600 800 1600 2400 3200 Our calculations R-N-Pb 800 R-C-O 1100 R-C=O 1600 Our calculated band at 800 cm-1 could be observed at 200 4th order; 400 2nd order and 800 first order! This is one reason that the “fingerprint” region is difficult to interpret
INSTRUMENTATION Generic Source not = UV-Vis Cell not = UV-Vis Monochromator Detector not = UV-Vis Spatial Arrangment Components not = UV-Vis Readout Solvents not = UV-Vis IR SOURCES: Nernst Glower (Blackbody) Tungsten-filament bulb (household) Hg arc Tunable CO2 laser IR DETECTORS What is the main problem in using a UV-Vis detector here?
IR DETECTORS • Thermal • What kind of problem can you • Anticipate here? • Thermocouple • 6 to 8 mV/uW • b. Bolometer or thermister • Change in resistance on T change Bi/Sb/Bi Voltage difference
Pyroelectric • Move charge with temperature • = capacitor • = capacitor current with T • Photoconductivity • low bandgap semiconductor e LUMO + HOMO
DESIGN OF INSTRUMENT • Double Beam vs Single Beam? • To Chop or not to Chop? • Whither the sample? • To FT or not to FT?
UV-Vis: Source - Monochrom – Sample – Detector Place the sample after the monochromator to decrease the Total power on the sample. Energy of individual frequencies Is large enough to remove an electron (break bonds) and Decompose the sample IR Source – Sample – Monochrom – Detector Sample not decomposed. Placing the monochromator After the sample can help prevent scattered radiation From entering the detector.
To FT or not to FT? Mirror velocity in a typical instrument is 0.01 to 10 cm/s Do we FT the instrument or scan through each individual wavelength? Why?
Optical resolution • Controls mirror • Eliminates Phase Shift Why should eliminating phase Shift be so important? Describe this instrument in terms of Various functional parts Instrument Range Resolution Cost Time Single Beam 1.3 to 29 4 16k 1s FT 0.4 to 1000 8 to 0.01 150k >1min http://www.wooster.edu/chemistry/analytical/ftir/ftir.swf Shows how the FT is generated by the movable mirror
SAMPLE HANDLING • Gases • Effusion of volatile liquid through a pin hole • Solution: need a cell that minimizes IR activity • of background Background? solvents (H2O) Air (H2O, CO2) windows (Si-O band in quartz)
One way to minimize solvent effects is to minimize the total amount of solvent Use a very thin cell (small value of b) How could we then determine the value of b?
Example Peak at N 1900 1 1400 2 900 3 Count the peaks between two known frequencies
SOLID SAMPLES Crush sample into a solid matrix (could also use as the “window” What kind of solid material would you chose and why? HINT Bond force constant Single 500 N/m Double 1000N/m Triple 1500N/m Ionic ???? Use an ionic solid to avoid background In the region of interesting covalent bonds KBr One difficulty here is the fact That the windows are now Water soluble Any other considerations important? Hint consider the scattered light equation
Example: Calculate single bond band for R-C-F; Bond k(Newton/m) Single 500 Double 1000 Triple 1500 The C-F bond is shifted out of the Region of the C-H bond. 3100-3010 cm-1
In your lab you used PTFE for your IR “plate” Polytetrafluorethylene 2009 student data http://www.internationalcrystal.net/polycard.htm 1080 predicted C-F
Pretty hard to pull Understandable changes Out of here