Download

1 / 31
310 likes | 422 Views
Bus-only Lanes on Wilshire. Who Wants Exemptions?. Sarah Peters. UP 206a. Final Project. Overview. Project Context Westside Exemptions Eastside vs. Westside Research Questions Method of Analysis Comparisons Summary Conclusions Data Sources. Pacific Ocean.

E N D
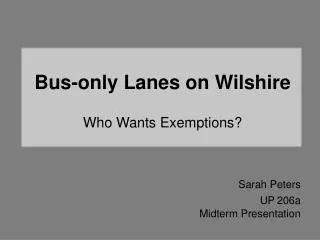
Bus-only Lanes on Wilshire Who Wants Exemptions? Sarah Peters UP206a Final Project
Overview • Project Context • Westside Exemptions • Eastside vs. Westside • Research Questions • Method of Analysis • Comparisons • Summary • Conclusions • Data Sources Pacific Ocean Photo credit: LA MTA website (thesource.net)
Project Context: Wilshire Boulevard • Major East-West corridor in LA County • Passes through cities of Los Angeles, Beverly Hills and Santa Monica • Served by Metro Rapid Bus 720 and Local Bus 20 • Wilshire serves approximately equal numbers of bus riders and drivers/passengers in private vehicles Los Angeles County Pacific Ocean City of Los Angeles Beverly Hills Santa Monica
Project Context: Wilshire Boulevard • In 2008 LA Metro and City of LA began studying peak-period bus-only lanes for Wilshire City of Los Angeles West Hollywood I-5 Beverly Hills • Lanes proposed from just west of downtown Los Angeles to Santa Monica border I-405 Westside Project Area I-10 Eastside Project Area • No bus-only lanes proposed for • Beverly Hills Santa Monica Culver City I-110 Pacific Ocean
Exemptions for the Westside: Comstock to Selby • Summer of 2010: Holmby-Westwood Property Owners Association (HWPOA) gets LA City Council support to preserve parking and curb cuts along Wilshire Beverly Hills • December 2010: HWPOA wins Metro Board approval to exempt Comstock-Selby segment from bus-only lanes Comstock Selby I-405 Federally-owned land Westwood Blvd.
Exemptions for the Westside: Brentwood Exemptions Beverly Hills • November 2010- • February 2011: Brentwood Homeowners Association lobbies for exemptions Holmby-Westwood POA Brentwood HOA I-405 Federally-owned land • February 2011: LA City Council requests that Metro planners study BRT without Westside bus-only lanes
Eastside vs. Westside City of Los Angeles I-5 Holmby-Westwood POA Brentwood HOA Beverly Hills Eastside Project Area (no exemptions sought) Westside Project Area (exemptions sought) I-10 Santa Monica I-405 Currently under study: Exemptions from bus-only lanes for the entire Westside Project Area
Research Questions Photo credit: LA WAD, flickr.com 1. Are there demographic differences between residents who organized against bus-only lanes and their neighbors who did not? 2. Are there demographic differences between Westside and Eastside service areas?
Data Sources • American Community Survey 2005-2009 Estimates for Census Blockgroups in LA County • (data on income, race and transit commuters) • Homeowners association boundary maps from HOA websites Photo credit: LA MTA website (thesource.net)
Method of Analysis: Define Exemption-Seeking Groups Beverly Hills Brentwood HOA Holmby-Westwood POA Selected blockgroups (turquoise) Federally-owned land I-405 Step 1: Select Census blockgroups that overlap homeowners associations
Method of Analysis: Define Exemption-Seeking Groups Homeowners Associations Layer Step 2: Create layer of homeowners associations blockgroups
Method of Analysis: Network Analyst Step 1: Calculate ½ mile service area around 720 Rapid bus stops I-5 Homeowners Associations Layer I-10 I-405
Method of Analysis: Network Analyst Step 2: Select census blockgroups that intersect BRT service areas within City of Los Angeles
Method of Analysis: Network Analyst HOA blockgroups layer Step 3: Create layers from selected blockgroups Non-HOA blockgroups layer
Comparison: HOA blockgroups vs. Non-HOA Blockgroups Are there demographic differences between residents who organized against bus-only lanes and their neighbors who did not? HOA blockgroups Non-HOA blockgroups
Income: HOA vs. Non-HOA HOA blockgroups Non-HOA blockgroups Average Per Capita Income HOAs: $101,000 Non-HOAs: $64,000
Racial Composition: HOA vs. Non-HOA HOA blockgroups Non-HOA blockgroups Nonwhite Population HOAs: 14% Non-HOAs: 33%
Public Transit Use: HOAs vs. Non-HOAs HOA blockgroups Non-HOA blockgroups Public Transit Commuters HOAs: 1% Non-HOAs: 4%
Comparison: Eastside vs. Westside Are there demographic differences between the Westside and Eastside service areas? Westside service area I-5 Beverly Hills Eastside service area I-10 I-405
Income: Eastside vs. Westside Eastside service area Average Per Capita Income Eastside: $28,000 Westside: $64,000 Beverly Hills Westside service area
Racial Composition: Eastside vs. Westside Nonwhite Population Eastside service area Eastside: 78% Westside: 31% Westside service area
Transit Use: Eastside vs. Westside Public Transit Commuters Eastside service area Eastside: 20% Westside: 4% Westside service area Westside service area
Summary: Income • HOAs make about 1/3 per capita more than the rest of the Westside • Westside Service Area’s per capita income is 2x that of the Eastside Service Area
Summary: Racial Composition • 8/10 people in Eastside Service Area are people of color • 9/10 people in HOA blockgroups are white
Summary: Transit Use • Transit users are a minority of commuters in all areas • Eastside has more than 4x as many transit users as the Westside, and 20x the transit users of the HOA blockgroups
Summary: Populations • Eastside Service Area residents outnumber Westside residents • (both HOA and non-HOA) by 2-1
Summary • HOA population: 13, 402 • Everyone else: 148,791
Conclusions Photo credit: LA MTA website (thesource.net) • Race, income and geography are highly correlated in Wilshire corridor • Westside HOA residents exercised disproportionate power in planning process • Westside residents overall are less likely to use transit • Therefore HOA residents opposed to bus-only lanes may not have faced local opposition
Data Sources • Wilshire BRT project history: • Los Angeles Metropolitan Transportation Authority (Metro) website • http://www.metro.net/projects/wilshire/ • Los Angeles City Council • Meeting Agenda for January 28, 2011 • Streetsblog Los Angeles • http://la.streetsblog.org/2010/11/18/nimbys-in-westwood-threaten-wilshire-brt-project-west-of-beverly-hills/ • http://la.streetsblog.org/2011/02/02/council-votes-for-more-study-for-wilshire-bus-only-project/ • Homeowners Association boundaries: • Holmby-Westwood POA website • http://www.holmbywestwoodpoa.org/mission.html • Brentwood HOA website • http://www.brentwoodhomeowners.org/ • Census Blockgroup data: • American Community Survey 2005-2009 Estimates • http://www.socialexplorer.com/pub/reportdata/GeoSelection.aspx?Census=ACS2009_5yr&ReportId=R10039635