Download
1 / 60
600 likes | 605 Views
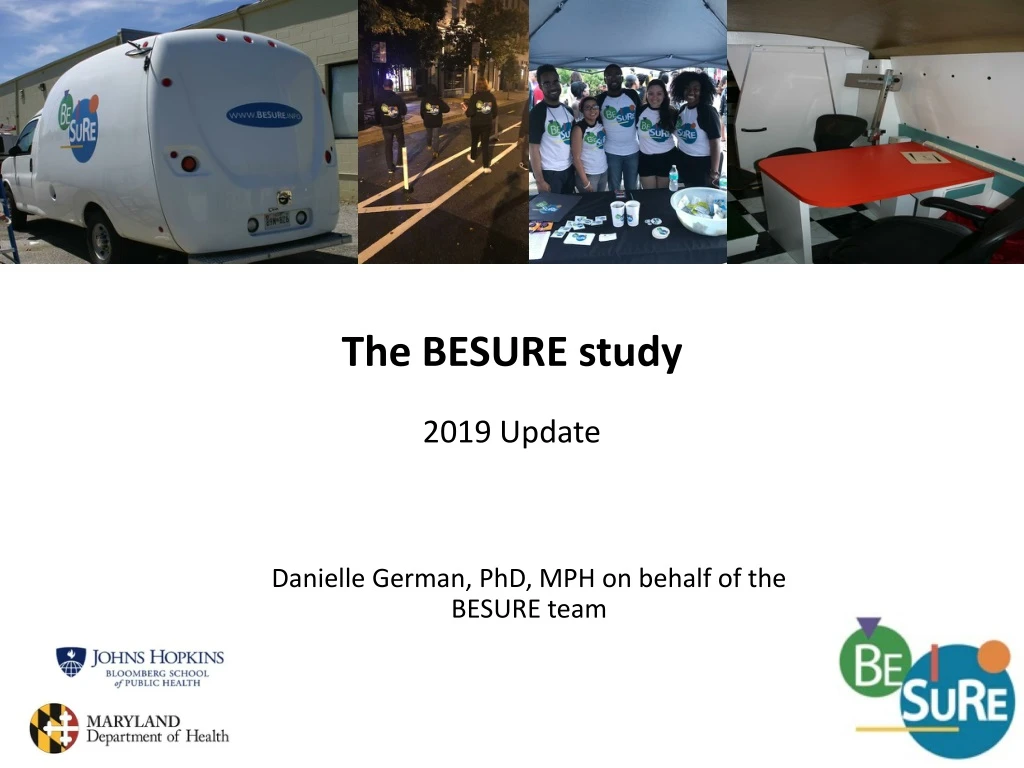
The BESURE study 2019 Update. Danielle German, PhD, MPH on behalf of the BESURE team. Overview. National HIV Behavioral Surveillance and BESURE Baltimore Data Overview HIV “Cascade” Indicators, All Waves IDU5 Data Update Upcoming HET5 Cycle. NHBS & BESURE.

E N D
The BESURE study2019 Update Danielle German, PhD, MPH on behalf of the BESURE team
Overview • National HIV Behavioral Surveillance and BESURE • Baltimore Data Overview • HIV “Cascade” Indicators, All Waves • IDU5 Data Update • Upcoming HET5 Cycle
National HIV Behavioral Surveillance (NHBS) • Implemented in up to 25 metropolitan areas (varied over time) • Major divisions of metropolitan areas with greatest numbers of AIDS cases in the U.S.
Baltimore HIV Behavioral Surveillance The BEhavioral SUrveillance REsearch Study Collaborative project of CDC, MDH, and JHSPH
Objectives • To assess prevalence of and trends in: • HIV risk behaviors • HIV testing behaviors • Exposure to and use of prevention and care services among persons at high risk for infection or transmission • HIV prevalence • … and annual survey on social issues, health, and well-being in Baltimore
Tested in the past two yearsamong self-reported HIV-negative participants
Newly diagnosedamong participants who tested positive MSM2-4, IDU3-4 are ART-adjusted
Newly diagnosedamong all participants MSM2-4, IDU3-4 are ART-adjusted
Ever seen an HIV care provideramong participants who reported an HIV diagnosis Note: small overall n, especially in HET cycles
Seen an HIV care provider in the past yearamong participants who have seen provider Dates are missing for IDU4 & HET4.
Taking antiretroviral medicationsamong participants who reported an HIV diagnosis
Viral suppression (undetectable*)among participants who reported an HIV diagnosis * self-reported
Viral suppression (undetectable*)among participants who reported taking antiretroviral medications * self-reported
BESURE IDU5 Data Update Socio-demographics and socio-behavioral indicators HIV prevalence by race/ethnicity, age, geography HIV drug-related risk behaviors STI & HCV testing and prevalence Selected local data
Socio-demographics and key indicators, BESURE PWID 2009-2018
Socio-demographics and key indicators, BESURE PWID 2008-2017 * In IDU2, the definition of homelessness included “temporarily staying with friends or relatives.” ** Transactional sex asked differently in different years: In IDU5 direct item in local survey while in IDU4 constructed from NHBS core survey items.
HIV prevalence by gender: PWID 2006-2018 The numbers of transgender participants has been low (n<5).
HIV prevalence by county: PWID 2006-2018 Very small proportion of participants outside of Baltimore City, especially prior to 2018
HIV drug related risk behaviors: PWID 2018In the past 12 months, how often did you... 35.4% 59.4% 40.4%
PrEP: PWID 2018 among those who reported being HIV negative (n=512)
PrEP: PWID 2018 among those who reported being HIV negative (n=512) among those aware of PrEP (n=141) PrEP aware 6 participants reported taking PrEP in the past 12 months. 3 of those reported taking PrEP daily.
HCV treatment: PWID 2018 Yes Did not completing course Did not respond Still taking treatment Responded but relapsed Completed full course Virus cleared
STI prevalenceamong 545 participants tested 1.3% chlamydia (n=7) 1.5% gonorrhea (n=8) chlamydia
Past year injection frequency: PWID 2018 *Differed by county of residence in chi2 test (p<0.05)
When you first used those painkillers, how did you obtain the drug? Were you hooked on painkillers before you injected drugs for the very first time? among 233 participants who reported being hooked on painkillers before first injection
In the past 30 days, have you heard or suspected that drugs you were using were cut or laced with Fentanyl? n=527
In the past 12 months, did you overdose on heroin or painkillers? By overdose, I mean if you passed out, turned blue, or stopped breathing from using drugs. In the past 12 months, when you injected drugs, how often was Narcan or Naloxone available to you in case of an overdose? It could have been yours or someone else’s. among 511 participants who reported having heard of Narcan.
In the past 12 months, how many times have you used Narcan or Naloxone on yourself or someone else?among 511 participants who reported having heard of Narcan. 45% (n=232) reported 0 times 54% (n=275) reported between 1 and 31 times mean among those reporting at least 1 use=3.40 In the past 12 months, that is, since [current month] of last year, how many times have you seen someone overdose from heroin, fentanyl, or opioid painkillers? 17% (n=96) reported 0 times 77% (n=453) reported having witnessed between 1 and 300 opioid overdoses mean among those reporting witnessing at least one opioid overdose=7.08
Received syringes from Syringe Service Program among PWID, BESURE 2018 Among 92% who received new sterile syringe in past year
Syringe Exchange ServicesIn the past year when trying to access needle exchange programs, how often have you faced each of the following?