Download
1 / 32
320 likes | 485 Views
Separation of Cosmic-Ray Components in Water Cherenkov Detector and use of neural networks to measure m /EM. Luis Villaseñor* and H. Salazar FCFM-BUAP. 5th International Workshop on Ring Imaging Cherenkov Detectors Playa del Carmen November 30 – December 5, 2004

E N D
Separation of Cosmic-Ray Components in Water Cherenkov Detector and use of neural networks to measure m/EM Luis Villaseñor* and H. Salazar FCFM-BUAP 5th International Workshop on Ring Imaging Cherenkov Detectors Playa del Carmen November 30 – December 5, 2004 *On Leave of Absence from IFM-UMSNH
Contents • Motivation to study m/EM separation • Experimental setup • Data • Composition of showers with known m/EM • Use of neural networks • Conclusions
Nm/Ne Strongly Correlated With Primary Mass, i.e. ~2 x for Fe wrt p
Use low energy data to get real m and EM traces to eliminate systematics due to detector simulation Look here To understand there
Measure Charge, Amplitude,T10-50,T10-90 with good precision for three different triggers. Arbitrary muons threshold of 30mV
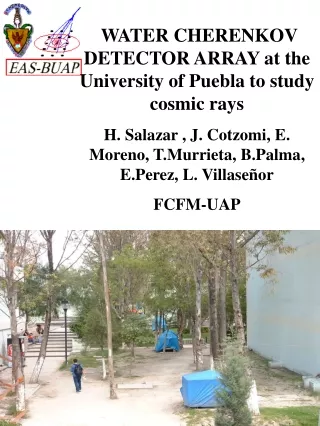
1.54 m diameter, 1.2 m water, one 8” PMT, tyvek 1/5 in volume of an Auger WCD
LabView based DAS
Low Charge Peak=0.12 VEM R muon = 876 Hz R EM = 80 Hz R shower (Q>7VEM) = 1 Hz Not an Artifact due to V threshold
Stopping muon at 0.1 VEM Decay electron at 0.18 VEM Crossing muon at 1 VEM Alarcón M. et al., NIM A 420 [1-2], 39-47 (1999).
Decay electron at 0.18 VEM Stopping muon at 0.1 VEM In this case Qpeak=0.12 VEM EM particles of ~ 10 MeV Crossing muon at 1 VEM
With PMT Glass Cherenkov signal
No PMT Glass Cherenkov signal
With PMT Glass Cherenkov signal
No PMT Glass Cherenkov signal
Separation of individual Muons and EM particles is Easy for low energy Calibration events
Stopping muon or electron Q~0.12 VEM (9 pe) T12~3ns Isolated Muon Q~1 VEM (74 pe) T12~12 ns Shower Q>7 VEM (500 pe) T12>15ns
Data trace Q=7.8 VEM 8 muons 15 ns 4 muons, 15ns 33 “electrons” 25 ns 66 “electrons” 25 ns
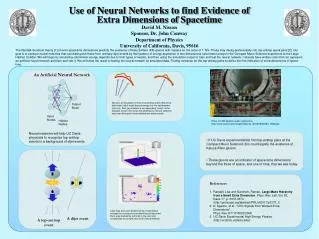
Training and Clasification Results for a Kohonen Neural Network 4 features as input (Charge, Amplitude, T10-50, T1090) 8 Neurons in first layer 4 in second layer 2 or 3 classes as output (8m, 4m + 33e, 66e)
Conclusions Clear separation of muons, electrons, PMT interactions and showers in a single WCD Rise time 10-50% is linear with Q/V Neural Networks classify composed events of muons and electrons better than randomly Shower data is dominated by muons To do: Apply to Auger with 25 ns sampling time.