Download
1 / 32
320 likes | 329 Views
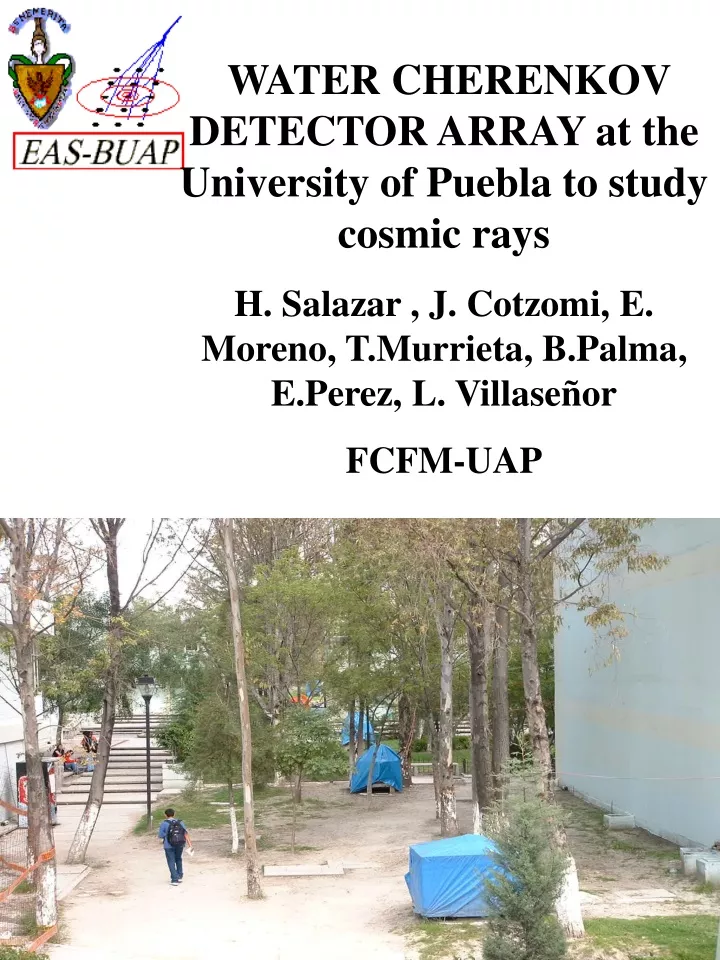
WATER CHERENKOV DETECTOR ARRAY at the University of Puebla to study cosmic rays H. Salazar , J. Cotzomi, E. Moreno, T.Murrieta, B.Palma, E.Perez, L. Villaseñor FCFM-UAP. EAS-BUAP : Design and Preliminary Results of the water Cherenkov array. Main goal :

E N D
WATER CHERENKOV DETECTOR ARRAY at the University of Puebla to study cosmic rays H. Salazar , J. Cotzomi, E. Moreno, T.Murrieta, B.Palma, E.Perez, L. Villaseñor FCFM-UAP
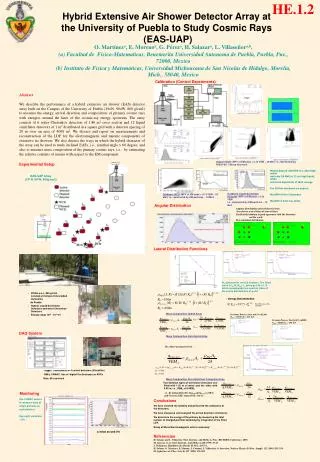
EAS-BUAP : Design and Preliminary Results of the water Cherenkov array Main goal: Contribute to the study of inclined showers and mass composition around the knee as well as educational training. *11+1 tanks filled with a layer of 12 cm high of liquid scintillator and 1 m2 effective area, mounted in a rectangular grid (40x100m2, 20m spacing). *3 Water Cherenkov detectors 2 m2 effective area 1 Water Cherenkov Detector (WCD), 10m2 effective area, 1.2m height.
EAS-UAP: First Stage, scintillator detectors. Full array and operational detectors in red . All signals are collected in a central acquisition station.
EAS-UAP Altitude ~2200 m above sea level, 800 g /cm2 Location: 190 N and 900 W.
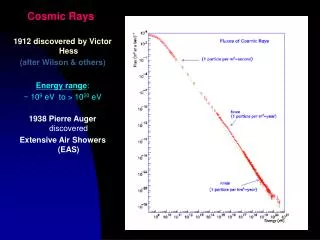
Energy range covered by the EAS-BUAP array: 1014 to 1016 eV.
The primary energy spectrum extends over many Orders of magnitude from GeV energies to 50 J. Power law spectrum with almost no structure Change in the spectral index at about 4 PeV(Knee) Slight steepening around 400PeV (second Knee) Flattening at the highest energies around 10EeV (Ankle) GZK Cutoff The origin of the Knee is still under discussion
Cosmic ray particles are most likely accelerated in strong shock fronts of supernova remnants (Fermi acceleration) Low Z(charge) particles are more likely to escape from the galaxy as compared to particles with high Z (gyromagnetic radii) The first Knee is due to the subsequent Cut-offs for all elements, starting with the proton component Second Knee could mark the end of the stable elements (Z=92)
Italy • Location: 2005 m a.s.l. • (820 g/cm2) • 35 detector stations of scintillators • 10m2 • Detector: Array, MACRO • Observables: Ne, muons • Status: stopped
Germany Location: 500 m a.s.l. (1020 g/cm²). 252 scintillator detectors Area: 200 X 200 m² Detector: Array, tunnel GRANDE Observables: Ne-Nu, hadrons, muons Status: running in set-up
Light-tight cylindrical container with inner reflective walls filled with liquid scintillator up to a height of 12 cm and one 5” PMT (EMI 9030A) facing down 70 cm above the surface of the liquid.. The trigger requires the coincidence of >4 signals in a rectangular sub-array with an area of 2929 m2. The measured trigger rate is 150 hour-1.
Calibration histograms EAS-UAP Scintillation detectors November 2004
Calibration histograms of the Water Cherenkov detectors
Angular distribution inferred directly from the relative arrival times of shower front in good agreement with the literature: cosp sen
Angular distribution from Cherenkov detector arrival times A = 4R² cos() + 2hR sen()
Example of lateral distribution of electromagnetic particles from Scintillation detectors
Muon/EM separation in Water Cherenkov detectors For details see Villasenor L. talk at Rich 2004
Discussion on composition We have checked the stability and performed the calibration of the detectors. We have measured and analyzed the arrival direction of showers. We determine the number of charged particles in each detector using the single-particle charge spectrum to obtain the LDF of (vertical) showers and the water cherenkov detectors to obtain the LDF in VEM’s. The shower core is located by the center of gravity and by fitting the measured charged particle distribution to the NKG function. Muon/Electromagnetic content from: S(VEM)= Nm*VEM + Nem*VEM/W1 S(Nt)= Nm + W2Nem, with W1 ~24 andW2 ~2.4 But simulation of the detection process is needed for fine tuning of these weigths!
TOWARDS THE MOUNTAIN TEST ARRAY RAMPA ALT: 4560 N 18° 59’ 03.9’’ W 97° 18’ 44.7’’ SUR NORTE ALT: 4558 N 18° 59’ 02.9’’ W 97° 18’ 45.2’’ ALT: 4558 N 18° 59’ 04.6’’ W 97° 18’ 45.4’’ CENTRO ALT: 4557 N 18° 59’ 03.7’’ W 97° 18’ 45.5’’ CABAÑA ARENA ALT: 4557 N 18° 59’ 04’’ W 97° 18’ 46.4’’ Thanks to INAOE- LMT for the site!
Construction in progress: Hybrid Mountain Array to determine mass composition Cherenkov DETECTORS fluorescence detector Acknowledgements to students! Eduardo Moreno, Jorge Cotzomi, Epifanio Lancho, Marcelino Anguiano, Saul Aguilar, Guillermo Ontiveros, Isabel Pedraza, Tirso Murrieta, Bianey Palma, Gonzalo Perez
Acknowledgements This work was done with partial support of the CONACY-G32739E And University of Torino University of Puebla Fermilab Students: Eduardo Moreno Barbosa Jorge Cotzomi Paleta Epifanio Lancho Marcelino Anguiano Saul Aguilar Guillermo Ontiveros Isabel Pedraza Tirso Murrieta Bianey Palma Gonzalo Perez