Download
1 / 17
170 likes | 299 Views
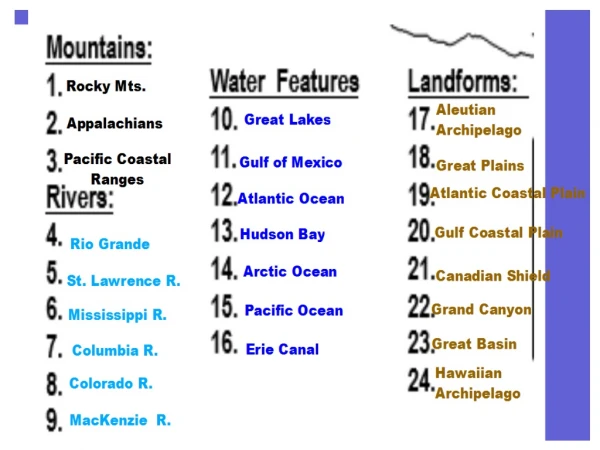
What are Latitudes and Longitudes?. Line of Latitudes. Line of Longitudes. How precise can we be with latitude and longitude?.

E N D
How precise can we be with latitude and longitude? Degrees of latitude and longitude can be further subdivided into minutes and seconds: there are 60 minutes (') per degree, and 60 seconds (") per minute. For example, a coordinate might be written 22° 30' 00" for point E. A If the lat or long given in decimal format you need to convert. For example 65º25.30’. It means 65º 25’ [0.30’ × 60’’]; that is 65º 25’ 18’’. A degree of latitude is approximately 69 miles, and a minute of latitude is approximately 1.15 miles. A second of latitude is approximately 0.02 miles, or just over 100 feet. Example: The distance from point A to B is approximately 69 miles. And the distance of E to C is approximately 17.25 miles (15 × 1.15 = 17.25). C B
Each contour line represents locations where a quantity has one, specific value. The contour interval is the difference or “jump” in value from one contour line to its neighboring contour lines.
Isobath Rules: • Isobath never touch one another (“cross”) or divide (“split”).
hill Contours in the shape of a ring represent either a hill or a depression. Depressions are marked by hatchures depression
V-Shape isobath showing a canyon under water If the contour lines bend into a “V”-shape, then there is a ridge (high place) or trough (low place) in the data
To construct a profile, follow the following steps: Step 1: Place the edge of a sheet of paper (paper ruler) along the selected line AB or XY Step 2: Transfer the isobath markings to paper ruler Step 3: Place the paper sheet (paper ruler) with its markings above or below the blank chart (is provided) Step 4: Depth marked on the paper ruler are carried straight upward to corresponding values on the parallel lines Step 5: Connect the dots with a smooth curve line this is your profile or cross section
a b c Township, Ranges, Sections