Download
1 / 35
350 likes | 591 Views
Solute transport in sediments. Physical properties Transport: Diffusion “Irrigation” Advection. Sediments magnified. -- Water + solids -- Solids a complex mixture of components. Burdige, 2006. General Features of the solids - Grain size. Burdige 2006. Porosity.

E N D
Solute transport in sediments Physical properties Transport: Diffusion “Irrigation” Advection
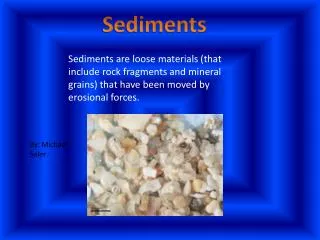
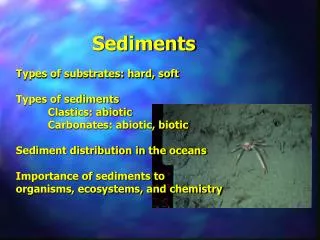
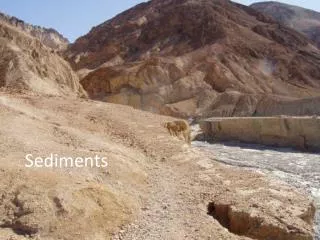
Sediments magnified -- Water + solids -- Solids a complex mixture of components Burdige, 2006
General Features of the solids - Grain size Burdige 2006
Porosity Definition: the volume of connected pore space, per volume of bulk sediment Measurement: measure sediment (1) wet, and (2) after drying in (typically) a 65° oven Then: Typical densities of dry sediments: 2.6-2.7 g/cm3
Porosity in near surface sediments -An example From a typical fine-grained (“clayey silt”) coastal sediment
Transport of solutes:Diffusion Definition : the process by which matter is transported as a result of random molecular motions (Crank, 1975) Small scale Randomly directed ==> diffusion transports matter from regions of high concentration to regions of low concentration Boudreau, 1996
The diffusion coefficient: Mathematically: C X J ~ mol / cm2/s D ~ cm2/s Increasing concentration Direction of diffusive transport
Diffusion coefficients of ions in seawater Depend on: water properties ion properties Ion properties: it’s transport we’re interested in: The “limiting equivalent conductivity” Water properties: the viscosity Bockris and Reddy, 1970
Data for diffusion coefficients(see Boudreau, 1996, for tables and procedures) Limiting equivalent conductivities have been measured (sometimes as ƒ(T)) for many ions. With this, R = gas constant F = Faraday constant Z = ion charge = lim. Equiv. conductivity Accounting for solvent viscosity: For temperature dependence: Either tabulated, or For seawater: 0.92 (25°) to 0.95 (0°)
What about for uncharged species? An empirical relationship… T = absolute temperature µ = dynamic viscosity of water Vb= molar volume of nonelectrolyte at normal b.p. of solvent And empirical equations based on experimental data for important solutes - eg O2 and CO2
Back to diffusion of solutes in sediments A fraction of the path is blocked by particles porosity A “tortuous” path tortuosity
Determining tortuosity:The “formation factor” A 4-pronged probe: Voltage difference is proportional to Specific resistance of the medium Measure (1) bulk sediment (2) overlying water Measure voltage difference Apply current
Example F is closely related to porosity for a given Sediment: C~1; n~2-4
Finally… The diffusive flux in a porous medium:
One last remark A general, qualitative relationship… Can be derived from consideration of diffusion as a “random walk” The “average” (root mean square) distance of transport of a substance by diffusion in the time interval, t:
Solute transport by “irrigation”… mostly driven by macrofauna Example: pore water dissolved oxygen profiles (a shallow water site) Data from Fred Sayles
Comparing fluxes:Diffusive fluxes from pore water profiesvsFluxes from in situ benthic flux chambersLocation: Massachusetts Bay, water depth 35m
Bill Marti Comparisons in Offshore, Continental Slope Sediments 2x “Biological enhancement factor” vs. water depth ~50 µmol O2/cm2/y
Example: Rn-222 deficits in Buzzards Bay:winter: alpha ~ 0spring / summer: alpha > 0
Rn results:Continental slope Filled : Rn-222 production rate Open: Rn-222 measured in pore water Dashed line: Rn-222 model: diffusion only
Another Problem…Solute concentrations in burrows are not constant
And: 1. Flushing can affect reaction rates e.g. : removal of products 2. Burrows are active environments on their own
Viewing sediments as a 2-dimensional system:The “average microenvironment”
…Applying the 2-D model to data… Parameters: r1 = 0.05 cm: est. based on numerically dominant poychaete L = 15 cm: est. from x-radiographs R = based on incubations for SO4 and NH4+; for SiO2, assume Ceq = 577µM; vary rate constant to fit r2 = 2.1 cm: varied to fit NH4+ profile; used for other 2 solutes
Advective flow through sediments Permeability: Relates the velocity of fluid flow through a porous medium in response to a pressure gradient Unit = darcy Permeability is related to Grain size:
Relict sands -- e.g. on continental shelves --do contain fine-grained particlesand are sites of diagenetic cycling Excess Pb-210 Inventories -- Contintental shelf
Advective flow through permeable sediments in response to bottom currents flowing over “rough” features : e.g., mounds or dunes High pressure Low pressure
Flow+filtering of particles from flow … Measurements of dissolved Oxygen around a mound -- Results from experiment in a flume