Download
1 / 7
80 likes | 89 Views
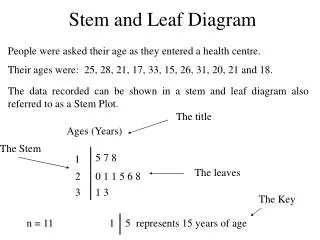
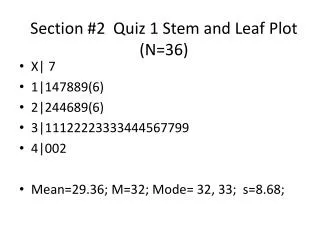
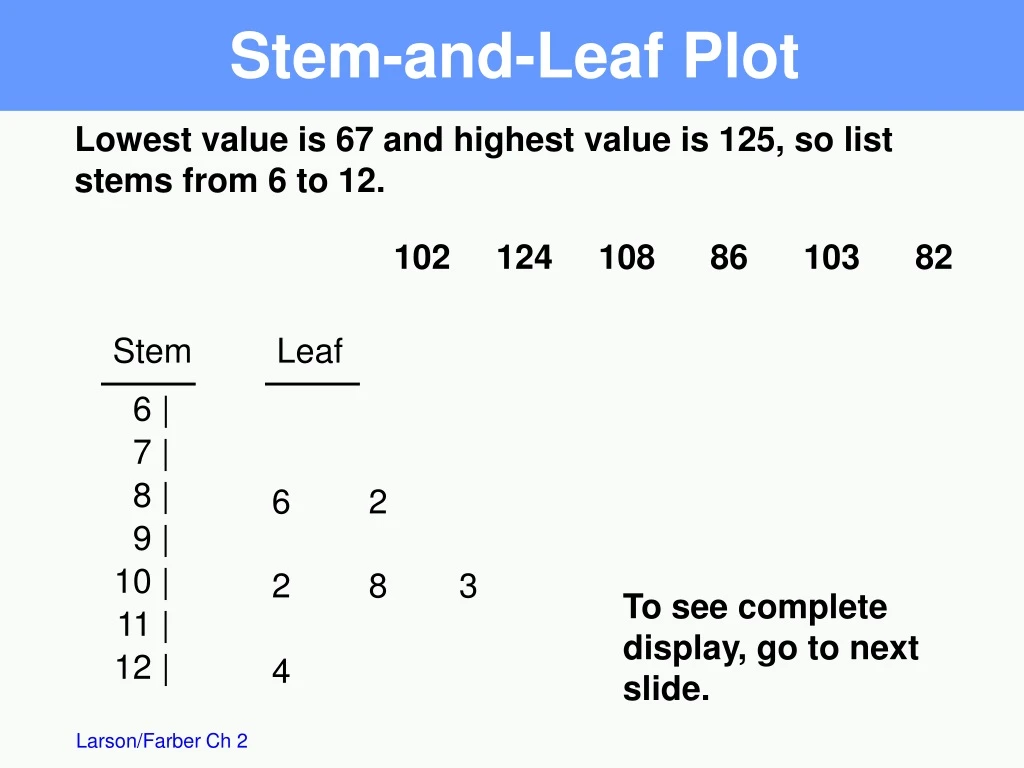
6 | 7 | 8 | 9 | 10 | 11 | 12 |. Stem-and-Leaf Plot. Lowest value is 67 and highest value is 125, so list stems from 6 to 12. 102 124 108 86 103 82. Stem. Leaf. 6. 2. 2. 8. 3. To see complete display, go to next slide. 4. 6 | 7 7 | 1 8 8 | 2 5 6 7 7

E N D
6 | 7 | 8 | 9 | 10 | 11 | 12 | Stem-and-Leaf Plot Lowest value is 67 and highest value is 125, so list stems from 6 to 12. 102 124 108 86 103 82 Stem Leaf 6 2 2 8 3 To see complete display, go to next slide. 4
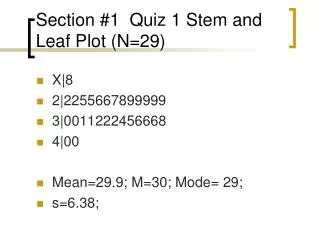
6 | 7 7 | 1 8 8 | 2 5 6 7 7 9 | 2 5 7 9 9 10 | 0 1 2 3 3 4 5 5 7 8 9 11 | 2 6 8 12 | 2 4 5 Stem-and-Leaf Plot Key: 6 | 7 means 67
6 | 7 7 | 1 7 | 8 8 | 2 8 | 5 6 7 7 9 | 2 9 | 5 7 9 9 10 | 0 1 2 3 3 4 10 | 5 5 7 8 9 11 | 2 11 | 6 8 12 | 2 4 12 | 5 Stem-and-Leaf with two lines per stem Key: 6 | 7 means 67 1st line digits 0 1 2 3 4 2nd line digits 5 6 7 8 9 1st line digits 0 1 2 3 4 2nd line digits 5 6 7 8 9
Dot Plot Phone 66 76 86 96 106 116 126 minutes
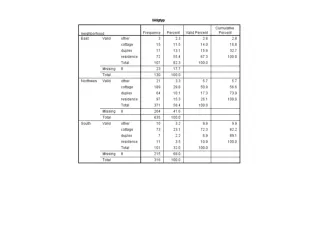
Used to describe parts of a whole Central Angle for each segment Pie Chart NASA budget (billions of $) divided among 3 categories. Billions of $ Human Space Flight 5.7 Technology 5.9 Mission Support 2.7 Construct a pie chart for the data.
Pie Chart Human Space Flight 40% NASA Budget (Billions of $) Billions of $ Degrees 143 Human Space Flight 5.7 149 Technology 5.9 68 Mission Support 2.7 360 14.3 Total Mission Support 19% Technology 41%
Scatter Plot 95 90 85 80 75 70 65 60 55 50 45 40 16 0 2 4 6 8 10 12 14 Absences Grade x 8 2 5 12 15 9 6 y 78 92 90 58 43 74 81 Final grade (y) Absences (x)