Download

1 / 30
300 likes | 536 Views
Ogive, Stem and Leaf plot & Crosstabulation. Ogive. An ogive is a graph of a cumulative distribution.. The data values are shown on the horizontal axis. Shown on the vertical axis are the: cumulative frequencies, or cumulative relative frequencies, or cumulative percent frequencies.

E N D
Ogive, Stem and Leaf plot & Crosstabulation
Ogive • An ogive is a graph of a cumulative distribution.. • The data values are shown on the horizontal axis. • Shown on the vertical axis are the: • cumulative frequencies, or • cumulative relative frequencies, or • cumulative percent frequencies
Ogive The frequency (one of the above) of each class is plotted as a point. The plotted points are connected by straight lines.
100 80 60 40 20 Ogive with Cumulative Percent Frequencies Example of an Ogive (89.5, 76) Cumulative Percent Frequency Parts Cost ($) 50 60 70 80 90 100 110
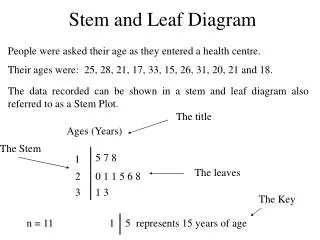
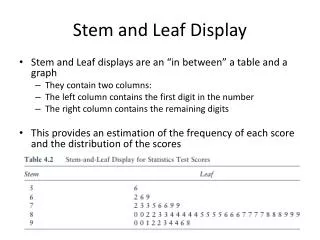
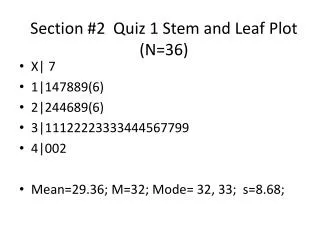
Stem and Leaf Plots • 1. Sort data *** • 2. Round data (if necessary) • 3. Create TWO new columns (stem and leaf) • 4. Put “stem” in one column and “leaves” in another. • 5. Format the leaves column to be left-aligned.
What we have done • Summary of variables • Qualitative: • Numeric: Frequency, relative frequency, percentage frequency, cumulative frequency, cumulative relative frequency, cumulative Percentage • Graphical: Bar (column) chart, pie chart
What we have done II • Quantitative: • Numeric: Frequency, relative frequency, percentage frequency, cumulative frequency, cumulative relative frequency, cumulative Percentage • Graphical: histogram, stem and leaf, Ogive, boxplot
Another thing of interest to statisticians • Relationship between variables • Variables: • Quantitative • Qualitative
Relationship between variables • Qualitative vs. qualitative: Crosstabulation • Qualitative vs. quantitative: ANOVA etc. • Quantitative vs. quantitative: Regression etc.
What crosstab tells us? • Cross Tabs: a tabular summary of data for two variables • Marginal Distributions/Probabilities: totals/probabilities in the margins of the cross tabulation.
Marginal Distributions • Ginobli’s game play distribution • Played: 44; Missed: 38 • Spurs’ season breakdown • Win: 54; Lose: 28
Marginal Probabilities • Ginobli’s chance of playing: 44/82 • Spurs’ winning percentage: 54/82 • Row (column ) total / grand total
Some other Probabilities • Conditional Probability • Spurs’ winning percentage when Ginobli played. 32/44 • Cell count / row (column ) total Joint Probability: cell count /grand total E.g. The percentage of games that Spurs won and Ginobli played.
Probabilities From Crosstab • Marginal, joint and conditional • Marginal probability • row(column) total/grand total • Joint probability • cell count / grand total • Conditional probability • Cell count / row (column) total
What is the percentage of all patients who received a CHEAP positive test result? Is this a joint, marginal, or conditional percentage? • Marginal: 37.0%
Out of all the patients given the CHEAP test, what is the percentage of false negatives? Is this a joint, marginal, or conditional percentage? • Joint, 2% (this is where CHEAP is negative, but Actual SFI is positive)
What is the percentage of subjects diagnosed as positive by BOTH tests? Is this a joint, marginal, or conditional percentage? • Joint: 30%.
What is the percentage of correct diagnosis? • =(30+61)/100 = 91% • That is correct diagnosis of positive AND negative.
If someone gets the test result and it is “positive”, what is the chance that this person really has the disease. • 30/37=81% (conditional) • That means there is still 19% chance that this person does not have the disease.
Check this one out! • Homicide convictions in the state of Florida between 1976 and 1980. Did convicted person get death sentence? Is there a racial bias?
The other side of the story ii. • Table for those cases involving white victims
The other side of the story i. • Table for those cases involving black victims
This is what we call Simpson’s Paradox in statistics • Simpson’s paradox refers to the reversal in the direction of an X versus Y relationship when controlling for a third variable Z.
Another Example • Numbers of flights on time and delayed for two airlines at five airports in June 1991. • Alaska Airline American West Airline