Download
1 / 9
120 likes | 148 Views
John Snow. Highlights from pp. 19 – 26 in Gerstman (2003). Who was John Snow?. Victorian surgeon / anesthesiologist Realized his obligation went beyond treating individual patients Quintessential hero of epidemiology Insightful theory of disease Impressive methods of studies.

E N D
John Snow Highlights from pp. 19 – 26 in Gerstman (2003)
Who was John Snow? • Victorian surgeon / anesthesiologist • Realized his obligation went beyond treating individual patients • Quintessential hero of epidemiology • Insightful theory of disease • Impressive methods of studies
Snow’s Waterborne Theory • Based his theory on two facts • Early symptoms restricted to GI tract • Epidemics followed commerce and armies • Theorized cholera agent is: • swallowed • passed from person-to-person • multiplies within the host
Snow’s Epidemiologic Methods • Ecological study = compared rates by region • Cohort study = compared rates by water source • Case-control study = compared water source (exposure) in cases and non-cases
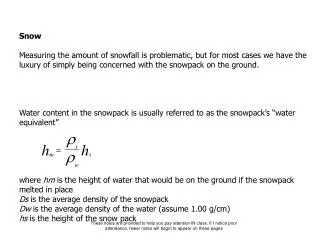
Ecological StudyKey data in Figure 1.13 (p. 24) • Columns in Table • Sub-district (neighborhood) • Population (denominator) • Cholera deaths 1853 (numerator) • Mortality per 100,000 = numerator / denominator × 100,000 • Water companies serving neigborhood • Example of rate calculation • Rate St. Saviour = 45 / 19,709 × 100,000 = 227 • Rate Christchurch = 7 / 16,022 × 100,000 = 43 • Water source • St. Saviour – Southwark and Vauxhall Water Only • Christchurch – Lambeth and Southwark and Vauxhall Water (both companies serving neighborhood)
Cohort Study Key data in Table 1.7 (p. 25) • Data by household water source • Rate per 10,000 • Rate Southwark & Vauxhall = 1263 / 40,046 × 10,000 = 315 • Rate Lambeth = 98 / 26107 × 10,000 = 37.5
Case-Control Study • Collect data on all cases • Determine source of water for cases and non-cases (“controls”) • See text (pp. 23 – 26) for selected interviews • Also see map – Fig. 1.14 (next slide) • Conclusion: Cases more likely to use water from Broad Street Pump
20th Century Epidemiology(p. 26) • Shift from acute contagious disease to chronic degenerative (noninfectious) disease • E.g.s. • British Doctors Study (Long Term Effects of Smoking) • Framingham Heart Study (Risk Factors for Cardiovascular Disease)