Download
1 / 14
140 likes | 309 Views
Model Calibration. upper prov. Snow. Lower prov. Streamflow. Soil parameter uncertainty: Greatest impact on ET in Intermediate years; Greatest impact on streamflow in dry years.

E N D
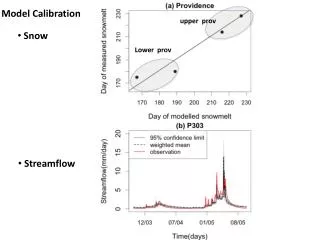
Model Calibration upper prov • Snow Lower prov • Streamflow
Soil parameter uncertainty: Greatest impact on ET in Intermediate years; Greatest impact on streamflow in dry years
For annual ET, August Q, and Annual NPP...the effect of soil parameter uncertainty is greater than the impact of a 2-4C warming
Model data-topics for next 3 years Post-disturbance eco-hydrology - changes in forest water use with species shift (collaboration with Moritz) - change in forest water use with thinning (cross-size Sierra comparison ) - changes in forest carbon cycling with climate – tree-ring/flux tower and LiDar integration (improved models of allocation/morality) Soil- biogeochemical cycling - nitrogen? Watershed – Regional Scale – geo-controls - efficient integration of geophysical data (spatial patterns of soil water availability, soil coverage) - integration of isotope (where plants get water) Vizualization of soil-water-eco interactions
PET Recharge (rain+snowmelt) Soil water holding capacity (SWC) AET/ Plant water use Drainage
How does what we assume about available soil water capacity influence actual ET(assuming different recharge time series, over 30 years) Mean Annual ET 6
Daily Recharge averaged over 30 years If things are warmer, snow melts earlier, more rain - this changes the pattern of recharge
How does what we assume about available soil water capacity influence actual ET(assuming different recharge time series, over 30 years) Mean Annual ET Change in Mean Annual ET, with warming 8
Cross site differences in response of AET estimates to change in recharge (snow to rain dominated) Change in Mean Annual ET, with warming Change in Mean Annual ET, with warming
Differences in Storm Event Precipitation - so when we shift from snow to rain - recharge looks different (CZO more likely to generate additional runoff) Differences in water/temperature limitation, timing of melt, growing season ET
Sampling site Model clustering map C2 C5 C3 C6 C1 C4 Hypothesis: Elevation and flow drainage may explain the spatial pattern of ecohydrologic responses to inter-annual climate variability.
Validation of sampling design(1) Cluster-5 HSI-3: Number of days that root-zone soil moisture is above 70% of saturation. WET Cluster-3 Year 2011 Cluster-4 Year 2011 Cluster-1 Cluster-2 Dry Cluster-6
(b) Catchment predictions • Soil parameter • Soil depths • Soil samples • SURROGO soil Microclimate (T, RH) LIDAR Topography Local error at six plots Model refinement LIDAR veg (rooting depth) • Soil moisture • Sapflux • Microclimate • Topography • Soil • Vegetation • ( rooting depth) Errors suggest limitations of simple assumptions of spatial uniformity (a) Plot scale predictions