Download
1 / 39
390 likes | 619 Views
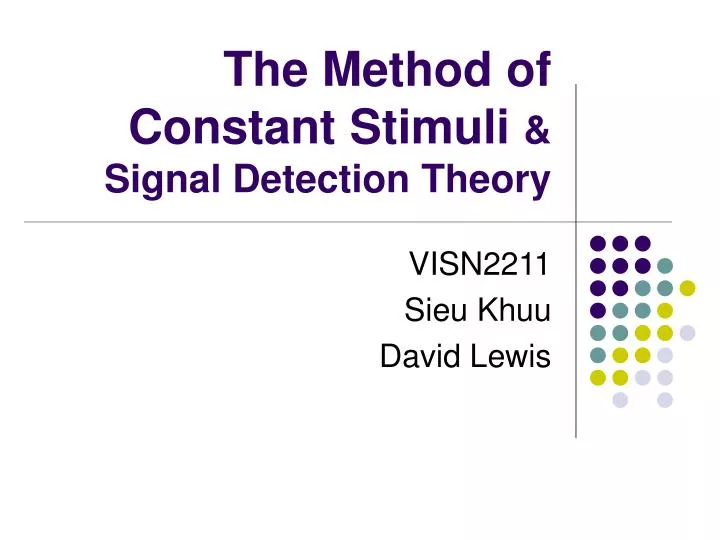
The Method of Constant Stimuli & Signal Detection Theory. VISN2211 Sieu Khuu David Lewis. Three Psychophysical Methods. The Method of Limits The Method of Adjustment The Method of Constant Stimuli Signal Detection Theory

E N D
The Method of Constant Stimuli & Signal Detection Theory VISN2211 Sieu Khuu David Lewis
Three Psychophysical Methods • The Method of Limits • The Method of Adjustment • The Method of Constant Stimuli • Signal Detection Theory • Used to determine perceptual sensitivity by measuring the point at which a stimulus is reported as being present (detection), or has changed in some manner (discrimination). • NOTE: This presentation will only describe these methods in terms of detection.
The Method of Limits • Stimulus intensity is either increased by a fixed amount from trial to trial, or decreased by a fixed amount. • Participants report when the start to be able to perceive the stimulus (increasing intensity), or when they can no-longer perceive the stimulus (decreasing intensity).
The Method of Adjustment • Stimulus intensity is adjusted by the participants until they can just barely perceive it’s presence.
Method of Constant Stimuli • Stimulus intensity is randomly altered from one trial to the next (within a fixed intensity range). • For each trial participants report the presence or absence of the stimulus. • The participants’ responses for each trial are plotted against the stimulus intensity to give a psychometric function. • For example…
Response Bias • Participants in psychophysical experiments can be biased towards a certain response. • I.e. “For every correct response you get a dollar.” • This would cause the participant to respond more often, resulting in more correct responses, but also more false alarms. • I.e. “For every correct response you lose a dollar.” • This would cause the participant to respond less often, resulting in less correct responses, but also less false alarms.
Signal Detection Theory (SDT) • Used to explain how stimuli are detected when there is background noise. • The more noise there is the harder it is to detect a stimulus. • The less noise there is the easier it is to detect a stimulus. • Response bias can have a strong affect on a participant’s responses. • SDT allows measurement of sensitivity regardless of response bias.
Signal Detection Theory History • In World War II radar waves were used to detect enemy aircraft. • The soldiers had to determine if the little spots of light are enemies, or simple noise (I.e. birds). • There was no clearly defined criteria for making these kinds of decisions. • Consequences: • If a enemy went undetected, people could be killed. • If noise was interpreted as an enemy, time and money would be lost and people would be put in harm’s way.
Decision outcomes & consequences SIGNAL: Are the spots on the screen enemies? yes no yes DECISION: Should you scramble the jets? no
Another Example • Children tend to be afraid of the dark and this can lead to a response bias. • In the dark strange noises seem to come from a monster under the bed or in the closet. • In the light most strange noises are completely ignored because no apparently threats are present. • Consequences: • Monsters could eat me. (worse) • Mommy could yell at me.
Decision outcomes & consequences SIGNAL: Are the noises coming from monsters? yes no yes DECISION: Should you cry for mommy? no
Response Bias & Outcome • Response bias is based on a participant’s preference for a particular outcome. • Preferences are based on costs & rewards • For example, • If a monster will eat me because I failed to detect him, that is a very high cost. • If mommy yells at me for waking her up for no reason, that is not a very high cost.
Criterion Level • Criterion level is set based on outcome preferences. • Criterion level: The intensity at which a signal will be reported as being present (Not the intensity at which it is perceived). • High Criterion: less hits but also less false alarms • Low criterion: more hits but also more false alarms
SDT: Discrimination probability Signal (monster) Noise stimulus intensity
SDT: Medium Discriminability - Criterion + Go back to bed Cry for mommy probability Noise Signal (monster) stimulus intensity
SDT: High Discriminability - Criterion + Go back to bed Cry for mommy probability Signal (monster) Noise stimulus intensity
SDT: Low Discriminability - Criterion + Go back to bed Cry for mommy probability Signal (monster) Noise stimulus intensity
Discriminabilty is independent of Criterion Discriminabilty (d’) Go back to bed Cry for mommy probability Noise Signal (monster) stimulus intensity
Estimation of d’ • d’ is the difference between the meansof the noise (mN) and the signal+noise (mSN) distributions, divided by the standarddeviation of the noise (sN). d’ = [mSN - mN] / sN • d’ is more easily computed from the hit rateand the false alarm rate. • Convert hit & false alarm rates (which are probabilities) to z scores from tables of z distribution: • Hit rate = P(yes|SN) => z( yes|SN ) • False alarm rate = P( yes|N ) => z( yes|N ) d’ = z( yes|SN ) - z( yes|N ) • Note: Decision criterion cannot change for the participant during the experiment or this equation will not work.
probability Noise Signal (monster) stimulus intensity probability Noise Signal (monster) stimulus intensity Interpreting d’ Low d’ • If d’ is low, then this means there is low discriminability. • The noise and stimulus are highly overlapping. • d’ = 0: pure chance • If d’ is high, then thismeans there is high discriminability. • d’ = 1: moderate performance • d’ = 4.65: “optimal” (corresponds to hit rate=0.99, false alarm rate=0.01) high d’
SDT Review • Perceptual decisions are made in the real world, which is full of noise. • Perceptual responses are biased with respect to a criterion. • A criterion level can change based on the preference for particular outcomes. • There is a trade-off between hit rate and false alarm rate. • Sensitivity/discriminability - the ability to discriminate a stimulus from noise - it is independent of the criterion. • d’ is a measure of discriminability that is insensitive to the criterion level. • d’ can be computed from the hit rate (proportion of stimuli detected when present) and the false alarm rate (proportion of stimuli reported when not present)
Experiment: Psychophysical Methods • Use the method of constant stimuli to study the tilt illusion. • Determine if center circle is tilted to the LEFT or RIGHT
Center 0° Surround 0°
Center 0° Surround 15°
Center 0° Surround 75°
Center 0° Surround 90°