Download
1 / 1
10 likes | 155 Views
Magnetic topology of Active Regions and Coronal Holes: Implications for Coronal Outflows and the Solar Wind.

E N D
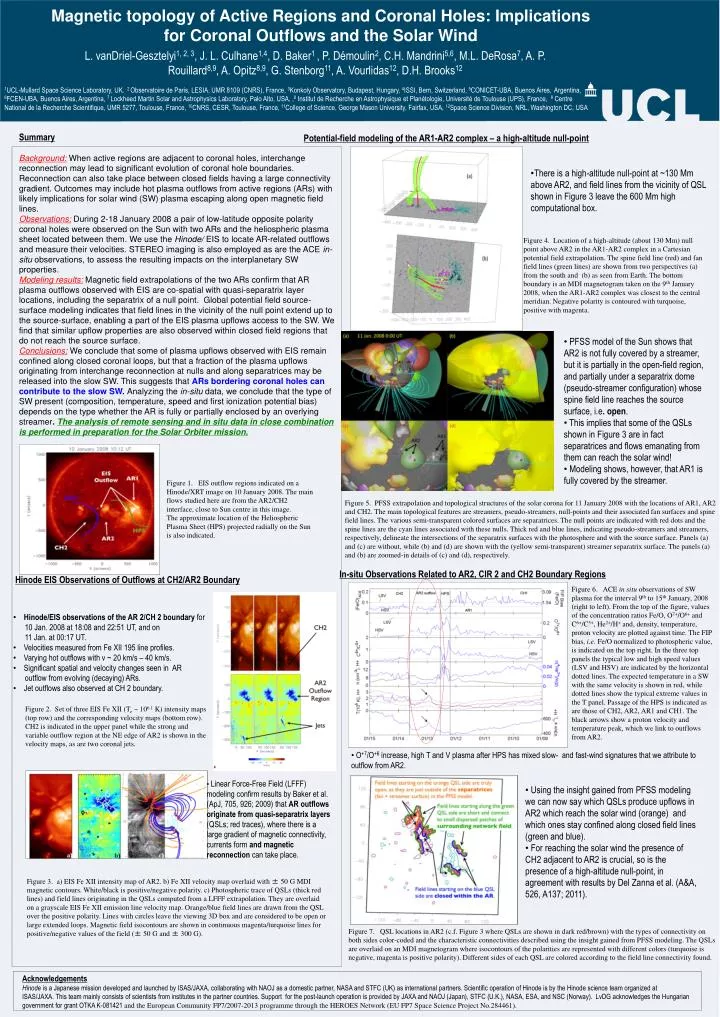
Magnetic topology of Active Regions and Coronal Holes: Implications for Coronal Outflows and the Solar Wind L. vanDriel-Gesztelyi1, 2, 3, J. L. Culhane1,4, D. Baker1 , P. Démoulin2, C.H. Mandrini5,6, M.L. DeRosa7, A. P. Rouillard8,9, A. Opitz8,9, G. Stenborg11, A. Vourlidas12, D.H. Brooks12 1UCL-Mullard Space Science Laboratory, UK. 2 Observatoire de Paris, LESIA, UMR 8109 (CNRS), France, 3Konkoly Observatory, Budapest, Hungary, 4ISSI, Bern, Switzerland,5CONICET-UBA, Buenos Aires, Argentina,6FCEN-UBA, Buenos Aires, Argentina, 7 Lockheed Martin Solar and Astrophysics Laboratory, Palo Alto, USA, ,8 Institut de Recherche en Astrophysique et Planétologie, Université de Toulouse (UPS), France, 9 Centre National de la Recherche Scientifique, UMR 5277, Toulouse, France, 10CNRS, CESR, Toulouse, France, 11College of Science, George Mason University, Fairfax, USA,12Space Science Division, NRL, Washington DC, USA . Summary Background: When active regions are adjacent to coronal holes, interchange reconnection may lead to significant evolution of coronal hole boundaries. Reconnection can also take place between closed fields having a large connectivity gradient. Outcomes may include hot plasma outflows from active regions (ARs) with likely implications for solar wind (SW) plasma escaping along open magnetic field lines. Observations: During 2-18 January 2008 a pair of low-latitude opposite polarity coronal holes were observed on the Sun with two ARs and the heliospheric plasma sheet located between them. We use the Hinode/ EIS to locate AR-related outflows and measure their velocities. STEREO imaging is also employed as are the ACE in-situ observations, to assess the resulting impacts on the interplanetary SW properties. Modeling results:Magnetic field extrapolations of the two ARs confirm that AR plasma outflows observed with EIS are co-spatial with quasi-separatrix layer locations, including the separatrix of a null point. Global potential field source-surface modeling indicates that field lines in the vicinity of the null point extend up to the source-surface, enabling a part of the EIS plasma upflows access to the SW. We find that similar upflow properties are also observed within closed field regions that do not reach the source surface. Conclusions: We conclude that some of plasma upflows observed with EIS remain confined along closed coronal loops, but that a fraction of the plasma upflows originating from interchange reconnection at nulls and along separatrices may be released into the slow SW. This suggests that ARs bordering coronal holes can contribute to the slow SW.Analyzing the in-situ data, we conclude that the type of SW present (composition, temperature, speed and first ionization potential bias) depends on the type whether the AR is fully or partially enclosed by an overlying streamer. The analysis of remote sensing and in situ data in close combination is performed in preparation for the Solar Orbiter mission. Potential-field modeling of the AR1-AR2 complex – a high-altitude null-point • There is a high-altitude null-point at ~130 Mm above AR2, and field lines from the vicinity of QSL shown in Figure 3 leave the 600 Mm high computational box. Figure 4. Location of a high-altitude (about 130 Mm) null point above AR2 in the AR1-AR2 complex in a Cartesian potential field extrapolation. The spine field line (red) and fan field lines (green lines) are shown from two perspectives (a) from the south and (b) as seen from Earth. The bottom boundary is an MDI magnetogram taken on the 9th January 2008, when the AR1-AR2 complex was closest to the central meridian. Negative polarity is contoured with turquoise, positive with magenta. • PFSS model of the Sun shows that AR2 is not fully covered by a streamer, but it is partially in the open-field region, and partially under a separatrix dome (pseudo-streamer configuration) whose spine field line reaches the source surface, i.e. open. • This implies that some of the QSLs shown in Figure 3 are in fact separatrices and flows emanating from them can reach the solar wind! • Modeling shows, however, that AR1 is fully covered by the streamer. Figure 1. EIS outflow regions indicated on a Hinode/XRT image on 10 January 2008. The main flows studied here are from the AR2/CH2 interface, close to Sun centre in this image. The approximate location of the Heliospheric Plasma Sheet (HPS) projected radially on the Sun is also indicated. Figure 5. PFSS extrapolation and topological structures of the solar corona for 11 January 2008 with the locations of AR1, AR2 and CH2. The main topological features are streamers, pseudo-streamers, null-points and their associated fan surfaces and spine field lines. The various semi-transparent colored surfaces are separatrices. The null points are indicated with red dots and the spine lines are the cyan lines associated with these nulls. Thick red and blue lines, indicating pseudo-streamers and streamers, respectively, delineate the intersections of the separatrix surfaces with the photosphere and with the source surface. Panels (a) and (c) are without, while (b) and (d) are shown with the (yellow semi-transparent) streamer separatrix surface. The panels (a) and (b) are zoomed-in details of (c) and (d), respectively. In-situ Observations Related to AR2, CIR 2 and CH2 Boundary Regions Hinode EIS Observations of Outflows at CH2/AR2 Boundary Figure 6. ACE in situ observations of SW plasma for the interval 9th to 15th January, 2008 (right to left). From the top of the figure, values of the concentration ratios Fe/O, O7+/O6+ and C6+/C5+, He2+/H+ and, density, temperature, proton velocity are plotted against time. The FIP bias, i.e. Fe/O normalized to photospheric value, is indicated on the top right. In the three top panels the typical low and high speed values (LSV and HSV) are indicated by the horizontal dotted lines. The expected temperature in a SW with the same velocity is shown in red, while dotted lines show the typical extreme values in the T panel. Passage of the HPS is indicated as are those of CH2, AR2, AR1 and CH1. The black arrows show a proton velocity and temperature peak, which we link to outflows from AR2. • Hinode/EIS observations of the AR 2/CH 2 boundary for 10 Jan. 2008 at 18:08 and 22:51 UT, and on 11 Jan. at 00:17 UT. • Velocities measured from Fe XII 195 line profiles. • Varying hot outflows with v ~ 20 km/s – 40 km/s. • Significant spatial and velocity changes seen in AR outflow from evolving (decaying) ARs. • Jet outflows also observed at CH 2 boundary. Figure 2. Set of three EIS Fe XII (Te ~ 106.1 K) intensity maps (top row) and the corresponding velocity maps (bottom row). CH2 is indicated in the upper panel while the strong and variable outflow region at the NE edge of AR2 is shown in the velocity maps, as are two coronal jets. • O+7/O+6 increase, high T and V plasma after HPS has mixed slow- and fast-wind signatures that we attribute to outflow from AR2. • Linear Force-Free Field (LFFF) modeling confirm results by Baker et al. (ApJ, 705, 926; 2009) that AR outflows originate from quasi-separatrix layers (QSLs; red traces), where there is a large gradient of magnetic connectivity, currents form and magnetic reconnection can take place. • Using the insight gained from PFSS modeling we can now say which QSLs produce upflows in AR2 which reach the solar wind (orange) and which ones stay confined along closed field lines (green and blue). • For reaching the solar wind the presence of CH2 adjacent to AR2 is crucial, so is the presence of a high-altitude null-point, in agreement with results by Del Zanna et al. (A&A, 526, A137; 2011). Figure 3. a) EIS Fe XII intensity map of AR2. b) Fe XII velocity map overlaid with ± 50 G MDI magnetic contours. White/black is positive/negative polarity. c) Photospheric trace of QSLs (thick red lines) and field lines originating in the QSLs computed from a LFFF extrapolation. They are overlaid on a grayscale EIS Fe XII emission line velocity map. Orange/blue field lines are drawn from the QSL over the positive polarity. Lines with circles leave the viewing 3D box and are considered to be open or large extended loops. Magnetic field isocontours are shown in continuous magenta/turquoise lines for positive/negative values of the field (± 50 G and ± 300 G). Figure 7. QSL locations in AR2 (c.f. Figure 3 where QSLs are shown in dark red/brown) with the types of connectivity on both sides color-coded and the characteristic connectivities described using the insight gained from PFSS modeling. The QSLs are overlaid on an MDI magnetogram where isocontours of the polarities are represented with different colors (turquoise is negative, magenta is positive polarity). Different sides of each QSL are colored according to the field line connectivity found. Acknowledgements Hinode is a Japanese mission developed and launched by ISAS/JAXA, collaborating with NAOJ as a domestic partner, NASA and STFC (UK) as international partners. Scientific operation of Hinode is by the Hinode science team organized at ISAS/JAXA. This team mainly consists of scientists from institutes in the partner countries. Support for the post-launch operation is provided by JAXA and NAOJ (Japan), STFC (U.K.), NASA, ESA, and NSC (Norway). LvDG acknowledges the Hungarian government for grant OTKA K-081421 and the European Community FP7/2007-2013 programme through the HEROES Network (EU FP7 Space Science Project No.284461).