Download
1 / 15
150 likes | 156 Views
Chinese Drought, Bread and the Arab Spring. Beijing, 2013. Natural hazards – food security – political stability. Troy Sternberg Geography University of Oxford. Great Wall. Selden Map, ca 1620 ‘Barbarians to the north’. China. 22% of world’s people, 7% of water

E N D
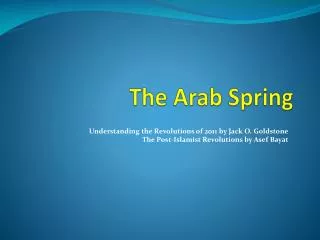
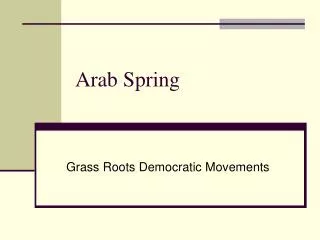
Chinese Drought, Bread and the Arab Spring Beijing, 2013 Natural hazards – food security – political stability Troy Sternberg Geography University of Oxford
Great Wall Selden Map, ca 1620 ‘Barbarians to the north’
China . . . • 22% of world’s people, 7% of water • 4 million km2 – largest dryland country in Asia • 60% agricultural production in northern China, 12% of the water • Farmland – decreased >6% 1997-2006 • > 50% urban Climate change – 1.50C temperature increase Climate hazards: 2008 – ice storms, 77 million people 2009-10 – drought in south, 60 million people 2010 – floods, 134 million people
Drought problem solution
Grandpa Wen’s Forest before after
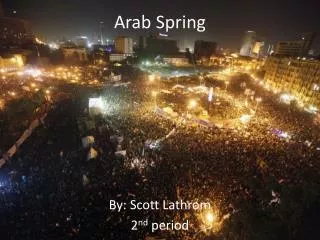
Globalization of hazards:Chinese drought, Bread and the Arab Spring Egyptian change – political and economic causes High cost of living 40% poverty rate Bread as a symbol of protest WHEAT ‘Non-political Bread Riots are Breaking Out in Egypt, Killing Three’ Wall Street Journal, Feb 01, 2011
WHEAT Role of the global market 2010 – decrease in world wheat production by major exporters Russia, Ukraine – drought, extreme heat Canada – cold, excessive rain Australia – excessive rain Changing climate patterns – El Nino, Pacific Oscillation Only 6-18% of wheat harvest exported Egypt – wheat low-value crop Grew higher value flowers and mangoes for export
Egypt 3% of GDP spent on wheat subsidies 1/3 of calories from bread ‘Bread Intifada’ 1977 Bread riots – 2008 August 2010 –Russia stops wheat export to Egypt Army runs wheat distribution system • Egypt imports from majors, Argentina, Romania, Kazakhstan…
Nov. 2010 – lack of rain concern about winter wheat (22 - 90% of total) crop failure China buys wheat on international market Government maintaining ‘social stability’ Wheat regionDrought Shangdong, Henan, Anhui – Standard Precipitation Index 250+ million people through Feb. 28, 2011 SPI drought values:<-1 moderate, <-1.5 severe, <-2 extreme drought Mckee et al. 1993, Wu et al. 2005, Sternberg et al. 2010 Chinalargest wheat producer/consumerusually self-sufficientlargest foreign reserves
Central Agricultural region – 525 million people Drought timescale‘worst in communist party history’ 3 month 6 month Government - $1.9 billion aid, irrigation, wells, water delivery
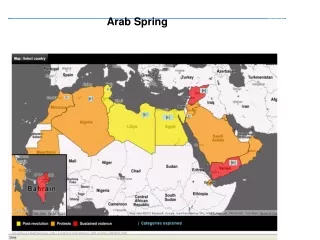
Wheat imports per capita Effect of drought on global wheat prices Future? _______________________ Sternberg, T. 2011. Regional Drought has a global impact. Nature. 472:169 Sternberg, T. 2012. Chinese Drought, Bread and the Arab Spring. Applied Geography, 34: 519-524. New York Times, March 3, 2013 – Opinion-Editorial 220% increase Countries impacted
Soybeans • 60% of world’s soybeans exported to China • 83% of soybeans imported from US, Brazil, Argentina • 16% demand increase - record 69 million metric tons pigs cows chickens Meat consumption quadrupled in 30 years, 75% protein from pork Litres of water needed per kg: vegetables - 322, pork - 6,000, beef 15,400
Environmental Challenges • 300 million people live on <$2 / day • 70% water unfit for human touch • North China – half groundwater unfit for industry • Coal processing consumes 1/6th of China’s water • Pollution – northerners die 5.5 years earlier (coal heating) • Air – Beijing ‘worst in world’? Particulate reaches US • 20-30% cropland contaminated (arsenic, lead, mercury etc) • Food safety/security China - 34% income on food. UK – 9% • 64% $ millionaires seeking 2nd residency Arsenic in Yunnan
Environmental rehabilitation • $635 billion on water projects, e.g. South-to-North canal • $76 billion on air • $5 billion on soil • $35 billion desertification Drinking water for Beijing ‘pipeline from Lake Baikal’ Chinese Academy of Sciences, May 2014 Agricultural land Model anti-desertification
Thank you Role for the UK ? Britain used as model for China ‘London's air pollution policies may help Beijing’ China Daily, 2013 Expertise, technology Environment, Water, Food