Download
1 / 23
230 likes | 244 Views
Estimation of Uniaxial Compaction Coefficient from GPS Measured Subsidence. by. Dr.PARUL R. Patel Senior Associate Professor Nirma University, Ahmedabad parul.patel@nirmauni.ac.in. Organization of Presentation. Introduction Objectives of the Study

E N D
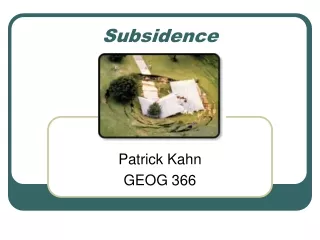
Estimation of Uniaxial Compaction Coefficient from GPS Measured Subsidence by Dr.PARUL R. Patel Senior Associate Professor Nirma University, Ahmedabad parul.patel@nirmauni.ac.in
Organization of Presentation • Introduction • Objectives of the Study • GPS Field Data Collection & Processing Methodology • Analysis of Results • Estimation of Uniaxial Compaction Coefficient • Conclusions
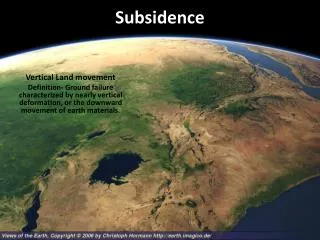
Land Subsidence Land subsidence is a gradual settling or sudden sinking of the earth's surface with or without horizontal movement Man-made Subsidence Occurs mainly due to • Mining activities • Underground construction activities • Extraction of natural resources like water/gas/oil
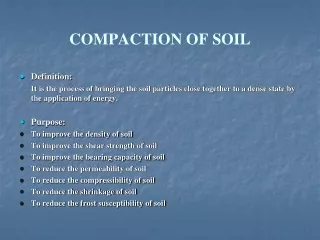
Mechanism of Land Subsidence due to Gas Extraction • Weight of overlying sediments partially supported by soil matrix and partially by gas/oil present in pores. • Pressure p declines, and overburden load transferred to soil matrix. • Compaction takes place if soil is compressible • Bowl-shaped depression appears with large displacement at centre.
Effects of Land Subsidence Even Settlement rarely causes any problems but uneven settlement creates problems • Changes in Elevation and Slope of Canals, Drains, Pipe lines etc • Damage to Infrastructure • Failure of Well Casings • Water Intrusion in Coastal Areas • Reduction in Permeability, Loss of Hydrocarbon productivity • Fault Reactivation Resulting in Seismic Activity • Development of Fissures and Sinkholes
Objectives of the Study • Use of GPS technique to monitor subsidence using a case study near Olpad Region, Surat, Gujarat • To identify and study effects of parameters responsible for land subsidence, like, pressure depletion, gas extraction, water level, Uniaxial Compaction Coefficient, Reservoir dimensions • Calculation of Uniaxial Compaction Coefficient
GPS used for Monitoring Subsidence • Ekofisk OilField, 1991-93, • Single Frequency Novtel, Novtel Software used • Groningen Gas Field, 1992-1993, • Dual Frequency, Bernese Software • Coachella Valley, California, 1996-98,Dual Frequency, GP Survey Software • Rafsanjan Plain, Iran, 1998-1999, • Leika, SKIPro Software • Ojiya City, Japan, 1996-98 , • Dual Frequency, Bernese Software • Jakarta, Indonesia, 1997-2001,Dual Frequency, Bernese Software
Reference Network & Monitoring Stations with Reservoir Boundary Deformation Stations with Reference Stations Locations of IGS Stations Deformation Stations and Presumed Reservoir Boundary Details of the Study Area
GPS Monument at Monitoring Station GPS Monument C/S of GPS Monument 4000 ssi Receiver with Choke Ring Antenna
Processing Parameters and Methodology • IGS stations tightly constrained, to get coordinates of all the four reference stations and IITB permanent reference station. • Coordinates of all 27-deformation stations were processed with two reference stations and IITB station by tightly constraining them.
Average Effective Subsidence for May Campaigns Rate of Subsidence 30 mm/year within Reservoir Boundary
Study of Reservoir Pressure and its behaviour May 2004 June 2007 Max. Pressure: 2290 kN/m2 at NSA4 Min. Pressure : 2034 kN/m2 at NSA2 Av. pressure of the reservoir: 2105 kN /m2 Max Pressure: 1336 kN/m2 at NSA2 Min. Pressure: 989 kN/m2 at NSA1 Av. pressure of the reservoir: 1098 kN/m2 Maximum Pressure Depleted on north side More Numbers of Gas Wells Located on North side Maximum Subsidence observed on North side
Relation Between Gas Extraction and Pressure Depletion Linear relation Between Gas Extraction & Average Pressure Pressure is Depleting Continuously with increase in Cumulative Gas Extraction
Relation between Cumulative Effective Subsidence & Cumulative Gas Extraction Linear Relationship is observed to be Suitable with Regression Analysis Correlation Coefficient is Found to be High 0.83 Gas Extraction is the major cause of Subsidence over the Study area
Relation between Water Level and Subsidence Seasonal Change Observed in Water Level and in Ellipsoidal Height Change in Water Level (Four Wells) Change in Ellipsoidal Height (Four Wells) No permanent water depletion observed Net reduction in the average Ellipsoidal Height
LaboratoryMeasured Cm Estimation of Uniaxial Compaction Coefficient (Cm) Cm = 2.7E-05 m2/kN Where, Modulus of Elasticity (E) =2.5E04 kN/m2 (Laboratory Measured) And Poisson’s Ratio (υ) = 0.33 Subsidence = Cm H Δp Subsidence = 953 mm For (Δp = 905 kN/m2, H=39 m) Subsidence Very High Compared to Measured Subsidence (86 mm) Laboratory Measured Cm Value usually overestimated
Average Cm for Four Wells Cm values Ranging from 1.27E-06 m2/kN to 3.70E-06 m2/kN Average Cm Value is 1.84E-06 m2/kN ∆s = (-1.84E-06) (∆p * H) R = 0.73 Cm = 1.84E-06 m2/kN For Barbara Field, Field Measured Cm Values were 2 x 10⁻⁷ to 5 x 10⁻⁷ m2/kN Laboratory Measured Cm values ranging from 1 x 10⁻⁶ to 5 x 10⁻⁵ m2/kN Laboratory Measured Cm is more than ten times toField Measured Cm with GPS
Subsidence Prediction based on Cm Calculated using Nucleus of Strain Method (Geertsma, 1978)(Assuming Reservoir Compaction ≠ Subsidence) Subsidence at the Centre of the Reservoir Value of ‘A’ depends on two Dimensionless ratios η=D/R and ρ = r/R D is the Depth of Burial (175 m), R is radius of Reservoir (2500 m), r is the distance of point from centre of the Reservoir (r=0) This Cm value used to predict subsidence from time to time over this reservoir
Conclusions • Effective subsidence over the study area was 86 mm during February 2004 to March 2007 within reservoir boundary • Subsidence is directly related to the amount of gas extracted and resulting pressure. A linear relationships are observed between: • Cumulative gas extraction and average reservoir pressure (R =0.99) • Subsidence and gas extraction ( R = 0.83) • subsidence and pressure depletion ( R = 0.534 to 0.82) • The average compaction coefficient Cm determined from GPS studies (assuming subsidence = compaction) is found to be 1.84E-06 m2/kN. • Subsidence prediction based on field measured is more acceptable than the laboratory measured uniaxial compaction coefficient, as it is always higher by one order of magnitude than the actual measured subsidence in the field. • Estimating Cm (assuming subsidence = compaction) based on GPS measured parameters and Nucleus of Strain Method is found to be 1.95E-06 m2/kN.