Download
1 / 34
350 likes | 501 Views
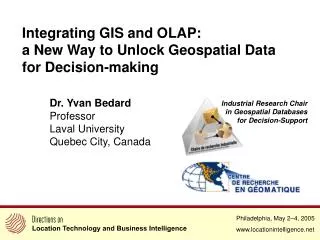
Integrating GIS and BI: a Powerful Way to Unlock Geospatial Data for Decision-Making. Professor Yvan Bedard , PhD, P.Eng . Centre for Research in Geomatics Laval Univ., Quebec, Canada National Technical University of Athens Mai 27 th , 2011 . Origins.

E N D
Integrating GIS and BI:a Powerful Way to Unlock Geospatial Data forDecision-Making Professor Yvan Bedard, PhD, P.Eng. Centre for Research in Geomatics Laval Univ., Quebec, Canada National Technical University of Athens Mai 27th, 2011
Origins • Organisations worldwideinvesthundreds of millions of dollars annually to acquire large amounts of data about the land, itsresources and uses • These data howeverprovedifficult to use by managers whoneed: • aggregated information - trends analysis • spatial comparisons - space-time correlations • fastsynthesis over time - unexpectedqueries • interactive exploration - crosstabanalysis • geogr. knowledgediscovery - hypothesisdev. • etc.
Barriers to make analysiswith transactional systems • GIS and DBMS design are transactional by nature • Oriented towards data acquisition, storing, updating, integrity checking, simple querying • Transactional databases are usuallynormalized so duplication of data is kept to a minimum : • To preserve data integrity and simplify data update • A strong normalization makes the analysis of data more complex : • High number of tables, therefore high number of joins between tables (less efficient). • Long processing time • Development of complex queries
Analytical approach vs transactional approach No unique data structure is good for BOTH managing transactions and supporting complex queries. Therefore, two categories of databases must co-exist: transactional and analytical (E.F. Codd). Example of co-existence: one source -> several datacubes AnalyticalData cubes Read-only Source Legacy transactional database Restructured& aggregated data ETL
BI Market • Business Intelligence exists since the early 1990s and its market is larger that the GIS market. However, it didn’t address spatial data until recently. BI and GIS evolved in different silos for many years. Eckerson, 2007
Today’s Level of Integration • Integrating GIS and BI is a recent field with a lot of potential Spatially-enabling BI is becoming more common Larger smiley = more has been achieved Larger lightning = more difficult challenge
HistoricalEpochs • 1996-2000: pionneering • early prototypes in universities • Laval U. - Simon Fraser U. - U. Minnesota • 2001-2004: earlyadopters • advanced prototypes in universities • first applications in industry • 2005-... : maturing • largernumber of ad hoc applications • SOLAP technologies to facilitate the development of SOLAP applications • 2010-…: wide adoption • 0ver 30 commercial products
Analytical System Architectures(ex. standard data warehouse) • OLAP • Dashboards • Reporting Legacy OLTP systems DW Datamarts
Analytical System Architectures(ex. without data warehouse) Legacy transactional databases Datacubes
All years Members Years 2010 2008 2009 Levels Months Days Datacube Concepts Dimension = axis of analysisorganizedhierarchically Hypercube = N dimensions Cube = casualname = hypercube Ex: a Time dimension 1/4
DatacubeConcepts Members= independantvariables Measures = dependant variables Dimension 1 (ex. balanced) Dimension 2 (ex. simpler) Dimension N (ex. N:Npaths) Measures(ex. sales) Dimension 3 (ex. unbalanced) Dimension 4 (ex. inconsistent) 2/4
2M 1M 2M 2M 3M 3M 2M 1M 2M 2M 2M 3M 2M 1M 1M 2M DatacubeConcepts Cube (hypercube) = all facts A "sales" data cube Fact:each unique combination of fine-grained or aggregated members and of their resulting measures Ex.: sold for 2M$ of blouses in Ottawa in 2010 Ex. : sold for 8M$ of pants in Ontario in 2010 Montreal A "sales territory" dimension Quebec Levis Toronto Ontario 2008 Ottawa 2009 A "time" dimension 2010 blouses jeans kakis Item level shirts Provinces Cities pants tops Category level A "product" dimension 3/4
Datacube Concepts • Data structures (MOLAP, ROLAP, HOLAP): • Multidimensional (proprietary) • Relational implementation of datacubes • Client tool provides the multidimensional view • Star schemas, snowflake schemas, constellation schemas • Hybrid solutions • Query languages: • SQL = standard for transactional database • MDX = standard for datacubes
Mixed spatial dimension Geometric spatial dimension Non-geometric spatial dimension Canada Canada … CB … Québec NB … Montréal Québec … … … Spatial Datacube Concepts Spatial dimensions N.B. more concepts exist 2/3
Metric operators Distance Area Perimeter … Topological operators Adjacent Within Intersect … Spatial dimension 1 Spatial dimension 2 Spatial Datacube Concepts Spatial measures 3/3 N.B. more concepts exist
Spatial Datacube and SOLAP • Spatial OLAP (On-Line Analytical Processing) • SOLAP is the most widely used tool to harness the power of spatial datacubes • It provides operators that don’t exist in GIS • SOLAP= generic software supportingrapid and easy navigation within spatial datacubes for the interactive exploration of spatio-temporal data havingmanylevels of information granularity, themes, epochs and display modes which aresynchronized or not: maps, tables and diagrams
Characteristics of SOLAP • Provides a highlevel of interactivity • response times < 10 seconds independently of • the level of data aggregation • today's vs historic or future data • measured vs simulateddata • Ease-of-use and intuitiveness • requires no SQL-type querylanguage • no need to know the underlying data structure • Supports intuitive, interactive and synchronizedexploration of spatio-temporaldata for differentlevels of granularityinmaps, tables and chartsthataresynchronizedatwill
The Power of SOLAP Lies on itsCapability to Support Fast and Easy Interactive Exploration of Spatial Data Select 1 year -> Select all years -> Select 4 years -> Multimap View: 7 clicks, 5 seconds
The Power of SOLAP Lies on its Capability to Support Fast and Easy Interactive Exploration of Spatial Data Select all regions -> Drill-down on one region -> Roll-up->Show Synchronized Views: 6 clicks, 5 seconds
The Power of SOLAP Lies on its Capability to Support Fast and Easy Interactive Exploration of Spatial Data Change data -> Roll-up -> Roll-up -> Pivot … : 6 click, 5 seconds
A Natural Evolution • Addcapabilities to existingsystems, don'taimatreplacingthem • Add value to existing data, no attempt to manage these data Nature of geospatial data GIS SOLAP Spatial Non-spatial DBMS OLAP DetailsSynthesis Decisional Nature of data
Functionalities: Spatial datacube structure • Contains spatial dimension organized in a hierarchy of spatial members with their geometry Lodging Streets Terrain Elevation Land use World Countries Map layers Provinces Abstraction layers
Functionalities: Interactive Explorationsupporting the true spirit of data drilling • Drilling is executed on a member or on a selection of several members (at the same or at different levels of detail of a dimension). Drilling by members at different level of details This is not OLAP drilling ! Country members Country layer Canada Spatial drill on Canada member Spatial drill on Country layer Result in province members of Canada only Result in opening the entire Province/states layer
Functionalities: Interactive ExplorationPivot on map • Changes the orientation of the dimensions to produce a new display. • Applied to a map = a different type of map • Built-in rules must exist to produce the pivoting map corresponding to dimensions selection instantaneously without SQL One map per year One row per year One map for all years One row for all years
Functionalities: Exploration-Oriented Visualization and advanced maps • Must support various types of maps (not only choropleth map) • Advanced maps are used to represent many dimensions or many measures on a map. • Built-in rules must exist to produce advanced maps instantaneously without SQL. Temporal multimap (one map per year) Map with superimposed diagrams Multithematic maps (many members in pie charts) (one measure/color + one measure/pattern)
Functionalities: Exploration-oriented Visualization andsynchronized displays All data per country • An operationon one type of display (e.g. drill, pivot or filter) must automatically replicate on all other types of display (when enabled). Canada Drill Down All data per province Canada Canada Provinces Provinces Provinces
Functionalities: Exploration-oriented Visualization andintelligent automatic mapping • Manual processing: • Involve specific knowledge by the user (database, semiology, mapping) • Is time-consuming • Intelligent automatic mapping: • Supports user’s knowledge • Generates coherent maps by using predefined display rules in accordance to the user’s selection • Instantaneous display • No SQL involved What color, symbol , pattern ? Which advanced map ? map thematic classification display type
Example of Measured Benefits in a Project for Transport QuebecM.J.Proulx, Intelli3 (2009)
Approaches to Develop SOLAP Applications • Ad hoc, proprietaryprogrammingspecific to one application • Combining GIS + OLAP capabilities • GIS-centric • OLAP-centric • Integrated SOLAP • Ad hoc programming (ex. using diverse open-source softwares) • SOLAP technology(the most efficient) -The dominant tool offers its full capabilities but gets minimal capabilities from the other tool -GUI provided by the dominant tool
Off-the-Shelf Integrated SOLAP Facilitates the deployment of a SOLAP application by offering built-in elements (e.g. Framework, operators, unique GUI) Total-integration capable but requiring programming Total integration (COTS) GIS or OLAP Dominant Loosely coupled Strongly coupled • 2 GUI vs common and unique GUI • Built-in integration framework (no need to program the solution) • Offers built-in functionalities to visualize and explore data • No dominant component 30
Video of an Example of SOLAP • Map4Decision (www.intelli3.com) • 100% Java • Reads MOLAP and ROLAPdatacubes • Reads all popular GIS files • The 1stSOLAP on the market • More than 30 SOLAP-like products exist • Map4Decision still leads with regards to • Variety of spatial datacubes • Multi-platform support • Integration of BI and GIS concepts • Ease of installation
Conclusion • GIS and BI have evolved in silos for manyyears • R&D bridgingbothuniversesstartedmid-90s • Marketisreachingmaturity • A scientificcommunityexists • Different application developmentapproaches • ad hoc • BI-centric • GIS-centric • Integrated • More R&D willbringevenbetter solutions
Thankyou! More info attheseweb sites: http://sirs.scg.ulaval.ca/yvanbedard/ http://www.spatialbi.com/ http://mdspatialdb.chair.scg.ulaval.ca/english/Eindex.asp Technologytransfer = Map4Decision ( www.intelli3.com)