Download
1 / 43
430 likes | 559 Views
Climate Disruption and Habitats of the Future. Michael Jennings, Ph.D. Department of Geography, University of Idaho . Climate Disruption and Future Habitats. Premises: Regional climates that we are familiar with are being disrupted by changes in atmospheric chemistry.

E N D
Climate Disruption and Habitats of the Future Michael Jennings, Ph.D. Department of Geography, University of Idaho
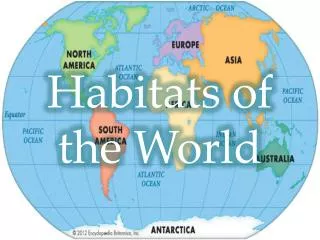
Climate Disruption and Future Habitats • Premises: • Regional climates that we are familiar with are being disrupted by changes in atmospheric chemistry. • These climate disruptions are causing shifts in habitats.
Celsius 4 0 -2.5 Change in Mean Annual Temperature 1870 – 2000 Weather Station Observation Interpolation Mean: 0.73 C SD: 0.57 Source: Jennings 2008. Data: U.S. National Center for Climate Research, 2008
CO2 Emissions Scenario Raupach et al. 2007. Proc. Natl. Acad. Sci. 104:10288–10293.
Variation In Predictions From Different General Circulation Models Surface Air Temp. C Time (years) Precip. mm/day Source: Covey et al. 2003. Global and Planetary Change 37: 103-133.
Boreal Conifer Forest Desert Ice Temperate Broadleaf Forest Temperate Conifer Forest Temperate Grassland Temperate Mixed Forest Temperate Woodland Tropical Deciduous Broadleaf Forest Tropical Evergreen Broadleaf Forest Tropical Grassland Tropical Woodland Tundra and Alpine Water Source: Gonzalez et al. Global Ecol. Biogeogr. 2010.
Boreal Conifer Forest Desert Ice Temperate Broadleaf Forest Temperate Conifer Forest Temperate Grassland Temperate Mixed Forest Temperate Woodland Tropical Deciduous Broadleaf Forest Tropical Evergreen Broadleaf Forest Tropical Grassland Tropical Woodland Tundra and Alpine Water Source: Gonzalez et al. Global Ecol. Biogeogr. 2010.
Boreal Conifer Forest Desert Ice Temperate Broadleaf Forest Temperate Conifer Forest Temperate Grassland Temperate Mixed Forest Temperate Woodland Tropical Deciduous Broadleaf Forest Tropical Evergreen Broadleaf Forest Tropical Grassland Tropical Woodland Tundra and Alpine Water Source: Gonzalez et al. Global Ecol. Biogeogr. 2010.
Sokolov et al. 2009. “Probabilistic forecast for 21st century climate based on uncertainties in emissions (without policy) and climate parameters.” Journal of Climate 22(19):5175-5204. Estimates a 5.18 C average global increase by 2100, compared to 2 - 2.5C that policy experts are focused on.
COP 15 COPENHAGEN December 2009 “ WITHOUT POLICY ” “. . . leaders announced on Nov. 15 what had already become evident — that no formal treaty could be produced anytime soon.”
COP 16, CANCÚN, November 2010 “ WITHOUT POLICY ” “There is no chance of completing a binding global treaty to reduce emissions of climate-altering gases . . . and there are no major new initiatives on the agenda.” There
COP 17 to be held in Durban, 28 November 2011 “ WITHOUT POLICY ” leaders failed to agree a binding pact at a summit in Copenhagen in 2009. Rich economies are reluctant to make substantial cuts in their emissions beyond 2012 without commitments from big developing economies like China and India to also curb their fast-rising emissions. At issue now is what can be salvaged from the talks. "This process is dead in the water," said Yvo de Boer, the former head of the U.N. Climate Change Secretariat who stepped down last year to work at KPMG, a consultancy and auditing firm. "It's not going anywhere," he said during the June 6-17 talks in Bonn among negotiators trying to avert more heatwaves, floods, droughts and rising sea levels. Disputes between rich and poor on sharing curbs in greenhouse gases mean gridlock over the Kyoto Protocol, the existing U.N. plan "Ask for a camel when you expect to get a goat," runs a Somali saying that sums up the fading of ambitions for United Nations talks on slowing climate change -- aim high, but settle for far less. Developing nations publicly insist the rich must agree far deeper cuts in greenhouse gas emissions, but increasingly believe that only a weaker deal can actually be achieved to keep the existing Kyoto Protocol, or parts of it, alive beyond 2012. "They have to ask for a camel ... but will settle for a goat," Mohamed Adow, of Christian Aid, said of poor nations' strategy at a just-ended session of 180 nations in Bonn. Hopes for a treaty have dimmed since U.S. President Barack Obama and other world "This process is dead in the water," said Yvo de Boer, the former head of the U.N. Climate Change Secretariat "They have to ask for a camel ... but will settle for a goat," Mohamed Adow, of Christian Aid, said of poor nations' strategy at a just-ended session of 180 nations in Bonn. Hopes for a treaty have dimmed since U.S. President Barack Obama and other world
Sokolov et al. 2009 • Updated the MIT Integrated Global System Model (IGSM): • Increased resolution of the atmospheric model; • Greatly improved the pelagic ocean model; • Implemented a sophisticated land system model; • Developed a more detailed representation of economies; • Used a new analysis of factors contributing to the uncertainty of emissions; • Used a more complete set of natural and anthropogenic forcings, such as C/N interactions;
Sokolov et al. 2009 • Updated the MIT Integrated Global System Model (IGSM): • Sensitivity to deep ocean heat is unresolved and potentially a large source of uncertainty. • Major progress in understanding dynamics of deep ocean heat made by Meehl et al. (September 2011, Nature Climate Change).
Equator N S
CO2 Emissions Scenario Raupach et al. 2007. Proc. Natl. Acad. Sci. 104:10288–10293.
Celsius 4 0 -2.5 Change in Mean Annual Temperature 1870 – 2000 Weather Station Observation Interpolation Mean: 0.73 C SD: 0.57 Source: Jennings 2008. Data: U.S. National Center for Climate Research, 2008
Celsius 17 0 -3 Change in Mean Annual Temperature 2000 – 2020 Hadley Model, SRES A1FI Mean: 0.93 C SD: 1.08 Source: Jennings 2009. Data:UK Meteorological Office, Hadley Centre, 2009
Celsius 17 0 -3 Change in Mean Annual Temperature 2000 – 2040 Hadley Model, SRES A1FI Mean: 1.47 C SD: 1.48 Source: Jennings 2009. Data:UK Meteorological Office, Hadley Centre, 2009
Celsius 17 0 -3 Change in Mean Annual Temperature 2000 – 2060 Hadley Model, SRES A1FI Mean: 3.09 C SD: 1.89 Source: Jennings 2009. Data:UK Meteorological Office, Hadley Centre, 2009
Celsius 17 0 -3 Change in Mean Annual Temperature 2000 – 2080 Hadley Model, SRES A1FI Mean: 3.95 C SD: 2.36 Source: Jennings 2009. Data:UK Meteorological Office, Hadley Centre, 2009
Celsius 17 0 -3 Change in Mean Annual Temperature 2000 – 2100 Hadley Model, SRES A1FI Mean: 6.08 C SD: 4.3 Source: Jennings 2009. Data:UK Meteorological Office, Hadley Centre, 2009
Novel and Disappearing Climate Types These are predicted types of climates that are outside the present-day climate envelopes of species and natural vegetation communities. Williams and others (2007) estimated that 12–39% of the world’s land could experience novel climates by year 2100 under an A2 Scenario. 10–48% of the world’s land could experience disappearing climates.
Expected Distribution of Future Climates That Do Not Exist In The Western US Today Source: Rehfeldt et al.
Koppen-Geiger Climate Types of Idaho
Southern Rocky Mountain Ponderosa Pine Woodland Sonora-Mojave Creosotebush-White Bursage Desert Scrub
Inter-Mountain Basins Mixed Salt Desert Scrub *Mean diurnal Temp. range / Annual Temp. range
20th Cen. climate niche space Novel and disappearing climate types The conceptual intersection among the fundamental niches for four species (colored ellipses) and climatic envelopes for hypothetical 20th- and 21st-century climates (black-bordered ellipses). 21st Cen. climate niche space Novel climates are the portions of the 21st-century envelope that do not overlap 20th-century climates. Disappearing climates are the portions of the 20th-century envelope that do not overlap 21st-century climates. Williams et al., PNAS 2007
20th Cen. climate niche space Novel and disappearing climate types Species co-occur only if their fundamental niches simultaneously intersect with each other and the current climatic space. Future climate change may cause a variety of ecological responses, including: 21st Cen. climate niche space (a) shifts in species distributions (species 1–3), (b) community disaggregation (species 1 and 3), (c) new communities forming (species 2 and 3), and (d) extinction (species 4). This conceptual model assumes fixed niches, i.e., that climate disruption will outpace evolutionary adaptation. Williams et al., PNAS 2007
Species-Area Curve S = cAz Can be solved by: log(S) = log(c) + z log(A) Or, can solve for “c” when z is known: c= S-Az S = species richness c = a fitted constant A = area z = the slope when both S and A are plotted on logarithmic scales The relationship between sampling area and bird species richness in North America. The data are plotted on a log-log graph to render the species-area curve into a relatively straight line. As the size of the sampling area increases , the number of bird species found also increases
Species-Area Curves and Extinctions Approximate elevational boundaries of the vegetation types on the isolated mountain ranges of the Great Basin (A) today, and (B) in the future with climate warming of 3 C. The species-area relationship can be used to predict changes in mammal species richness in the sky islands of the Great Basin due to climate change. The number of species were plotted as a function of the area above 2,280 m elevation. Arrows show the changes in area and numbers of species predicted due to changes in habitat area driven by climate changes. Lomolino et al., 2006
Ochotona princeps American pika Current suitable habitat Source: J Trook, Department of Geography, University of Idaho
Ochotona princeps American pika A2 Scenario 98% loss of habitat from current conditions by 2090 Source: J Trook, Department of Geography, University of Idaho
CO2 Emissions Scenario Raupach et al. 2007. Proc. Natl. Acad. Sci. 104:10288–10293.
Trend in CO2 Emissions Raupach et al. 2007. Proc. Natl. Acad. Sci. 104:10288–10293.
Trend in CO2 Emissions Source of 2006-10 data: Carbon Dioxide Information Analysis Center, U.S. Dept. Energy Raupach et al. 2007. Proc. Natl. Acad. Sci. 104:10288–10293.
Total carbon emissions from fossil-fuels 1750 - 2006 Million metric tons of C Year Source: Carbon Dioxide Information Analysis Center, U.S. Dept. Energy
Emission Rates and GHG Concentrations The concentration of CO2 is now about 389 - 390 ppm. At a given growth rate, what’s the doubling time for the concentration? Time Period Growth Rate (%) 1751–2005 2.9 1900–2005 2.4 2000–2005 3.9 @ 3% Doubling Time Calculation: yr
The time it will take to go from 390 to 780 ppm of atmospheric carbon at various growth rates: