Download
1 / 33
330 likes | 484 Views
Using the climate of the past to predict the climate of the future. Danny McCarroll Swansea. ‘ Millennium ’. European climate of the last millennium. EU 6 th Framework Integrated Project. 41 partners. January 2006 – Dec 2010. Why were we funded?. Reconstruct past climate

E N D
Using the climate of the past to predict the climate of the future Danny McCarroll Swansea
‘Millennium’ European climate of the last millennium EU 6th Framework Integrated Project 41 partners January 2006 – Dec 2010
Why were we funded? • Reconstruct past climate • Improve predictions of future climate change
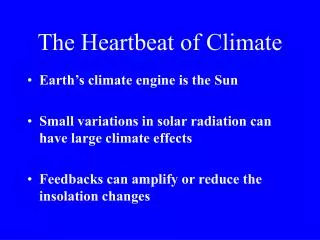
Climate Sensitivity “change in global mean equilibrium temperature after a doubling of atmospheric carbon dioxide” 1970s: 1.5 to 4.5˚C IPCC 2007: 2.0 to 4.5˚C “values substantially higher than 4.5˚C still cannot be excluded”
Likely range of mean global temperature increase by the end of the 21st Century A1B: 1.7˚C to 4.4˚C A2: 2.0˚C to 5.4˚C Temperature increases over land are likely to be roughly twice the global average and even larger in the north.
Ensembles of model runs predict many possible futures: which are most likely? Note the uncertainty Is not symmetrical Change in temperature after CO2 doubling. Black lines: 2579 climateprediction.net runs. Red lines:127 30-year Hadley Centre simulations Climateprediction.net
Simple one-box energy balance model to demonstrate the methodology 3 x CO2 stabilization scenario (similar to A1B until 2100) Without palaeoclimate constraint The overall likelihood of each model run is multiplication of: • model-data mismatch in temp. • likelihood of the choice of calibration scaling coefficient • model-data mismatch for the effective heat capacity of ocean in the instrumental period. With palaeoclimate constraint Millennium will use a GCM, incorporating the geography of climate changes, and better uncertainty estimates for the palaeoclimate reconstructions (Distributed via climateprediction.net) Hiro Yamazaki, Chris Huntingford, Myles Allen, Dave Frame
“Millennium test set” We do not need to fill every grid square Different squares can contain different climate data One square can contain several different climate variables No need to average over time or space
Winter temperature based on documentary evidence for dates of first and last ship to use Stockholm harbour Lotta Leijonhufvud, Rob Wilson, Anders Moberg The Holocene 2008, 18, 331-341
Extended back to AD 1500 Millennium special issue of Climatic Change
Documentary evidence (DE) • DE sources interpreted to ordinal scale indices • Indices express the temperature extremity of a given month (from -3 extremely cold to +3 extremely warm) National T index series: CEU T index series 1500 - 1854 • Germany (1500 – 1759) • Switzerland (1500 – 1816) • Czech Republic (1500 – 1854) • Poland (1500 – 1700) • Hungary (1500 – 1869) • Low Countries (1500 – 2000) used for cross- checking
Method of reconstruction Calibration 1771-1816 Linear regression model Verification II. 1760 - 1770 Verification I. 1817 - 1854 Calibration 1771-1816
Central Europe – monthly, seasonal and annual temperatures Dobrovolný P, Moberg A, Brázdil R, Pfister C, Glaser R, Wilson R, van Engelen A, Limanówka D, Kiss A, Halíčková M, Macková J, Riemann D, Luterbacher J, Böhm R (2009) Monthly and seasonal temperature reconstructions for Central Europe derived from documentary evidence and instrumental records since AD 1500
Northern tree line summer temperatures from tree rings: dominated by Volcanic forcing Sulphate loadings NH after Gao, and solar minima in green
Perturbed physics spin-up experiment. >25,000 variants of FAMOUS
The Millennium experiment • 148 model variants (perturbed physics) • 18 forcing combinations • (Same aerosol and greenhouse gas forcing) • Simulations AD800 to AD 2200 • Distributed in 200-year long work units • SRES A1B scenario until 2100 AD and held constant thereafter. • (They are not all ready yet, and lots of gaps!)
20,000 to 30,000 FAMOUS model simulations have been running simultaneously on volunteer’s computers
Selected reconstructions 1 North Atlantic, May-Oct, AD 1000-2000, marine proxies 2 Northern Fennoscandia, Jun-Aug, AD 1000-2004, tree-ring proxies 3 Alpine region, Jun-Aug, AD 1053-2007, tree-ring and lake proxies 4 Pyrenees, May-Sep, AD 1260-2005, tree-ring proxies 5 Northern Fennoscandia, Apr-May, AD 1693-2010, river ice break records 6 Southeastern Sweden, Jan-Apr, AD 1502-2008, harbour freezing records 7 Central Europe, Dec-Feb, AD 1500-2007, documentary and early instrumental 8 Western Europe, Dec-Feb, AD 1659-2010, instrumental observations 9 Northern Italy, Dec-Feb, AD 1789-2007, instrumental observations We have a lot more!
Model ranking procedure D2 = quadratic distance value D2 value is computed for each of the nine proxy sites D2 value computed using unforced simulations T-value tests null hypothesis forced = unforced Local T-values summed and normalized Used 30-year non-overlapping averages (33 points) Ranks plotted using colours, red (best 10) to blue. This is a first attempt using incomplete data- suggestions welcome! Hiro Yamazaki, Anders Moberg, Alistair Hind, Rolf Sundberg
Concerns • Model data still very incomplete • 200-yr work units limit scope for internal variability • 30-yr average may be too large for volcanic forcing • Should ranking exclude the ‘Greenhouse’ period? • Uncertainty in proxy reconstructions not yet included • Europe may be too small (internal > forced?) • All suggestions warmly welcomed
Conclusions • Method looks promising (but needs to be refined) • Likely range of future temperatures is constrained • Very high sensitivity models score poorly (good news) • Bad news: All reasonable models under A1B predict • >2 degrees C rise by 2100 for mean annual T of Europe