Download
1 / 32
320 likes | 436 Views
Nutrient Loading in Coastal Streams, Variation with Land Use in the Carpinteria Valley. Timothy H. Robinson Bren School of Environmental Science and Management University of California Santa Barbara. Introductions. Overview. Creeks of the Carpinteria Valley:. Arroyo Paredon

E N D
Nutrient Loading in Coastal Streams, Variation with Land Use in the Carpinteria Valley Timothy H. Robinson Bren School of Environmental Science and Management University of California Santa Barbara
Overview Creeks of the Carpinteria Valley: • Arroyo Paredon • CSM North Tributaries • Santa Monica • Franklin • Carpinteria/Gobernador • Lagunitas My research project: • Nutrient export • Modeling • Predictions
Methodology Identify land use classes and sampling site locations: Chaparral/Forest, Avocado, Greenhouse, Open-Field Nursery, Residential and Commercial Sampling strategies: Subcatchment, point discharge and above-below Sampling methods: Manual sample or ISCO auto-sampler GIS database development Data analysis Nutrient flux calculation (hydrology and stream chemistry) Nutrient export coefficient model development Integration with an urban growth model
Measuring Nutrient Concentrations Grab samples and ISCO auto- samplers
Specifics: Analyzing for: Ammonium (NH4+), Nitrate (NO3-), Total Dissolve Nitrogen (TDN), Phosphate (PO43-), Total Particulate Carbon (TPC), Total Particulate Nitrogen (TPN), Total Particulate Phosphate (TPP), Total Suspended Sediments (TSS) and major ions at selected locations • Frequency: • Regular sampling: • Once every 2 weeks during the dry season • Once a week during the wet season • Storm sampling: • Every hour on the rising limb of the hydrograph • Every 2-4 hours on the falling limb of the hydrograph Project duration: WY2001, WY2002 and WY2003
Measuring Stream Flow Staff Gauges and Pressure Transducers Surveying the Cross-Sections Developing Rating Curves
Stream Chemistry and Hydrology Carpinteria Creek (WY-2002)
10000 baseflow stormflow 1000 100 nitrate (µM) 10 1 Franklin Carpinteria Santa Monica 100 baseflow stormflow 10 phosphate (µM) 1 Franklin Carpinteria Santa Monica General Trends in Nutrient Concentrations by Watershed
Nutrient Loading Development of a Nutrient Flux Model Stream Chemistry Observed Stage PT Stage (5-min) Stage-Discharge Relationship (HEC-RAS) Stream Chemistry Observed Flow PT Flow (5-min) Flow (hourly) Stream Chemistry (hourly) Observed Flow (hourly) Flow (hourly) Identify: Baseflow, Peakflow.. Nut. Conc. Stream Chemistry (model/obs) Flow (hourly) Linear extrapolation Annual Nutrient Loading Nut. Flux (conc/flow)
WY2001 Basin Outlet Mass Flux WY 2001
S+P +ASMC Nutrient Export Coefficient Model E A GIS Datm LTER Datm Literature I Interview I Literature K Literature L k t D/V a LU GIS • Abbreviation key: • E – Export Coefficient Function • B – Watershed Response Variable • S – Soils • P - Precipitation • ASMC – Antecedent Soil Moisture Content • K – Down Stream Distance-Decay Function • k + a – Coefficients • t – Time • D – Distance Traveled Downstream • V – Average Velocity Traveled • Downstream
Integration with an Urban Growth Model (SLEUTH) • SLEUTH : an urban growth model implemented for the Santa Barbara area that predicts future land use, example 2050 • Enables comparison of future loadings to standards being set for stream water quality regulations (TMDLs) • Evaluation of proposed BMP mitigations
Significance of the Project • Presentations: • PhD Seminar, Bren School UCSB • Santa Barbara Coastal LTER Seminar, UCSB • University of California Toxic Substances Research & Teaching • Program, Annual Symposium, Long Beach • Coastal Water Resources, American Water Resources • Association 2002 Spring Conference, New Orleans • Southern California Wetlands Recovery Project, 2002 • Symposium, Ventura • California and the Worlds Oceans 02 Conference, Santa Barbara
Questions Thank you!!
Sampling Teams • Three teams sampling in and around storm events • Lower reach sites • Upper reach sites • Restricted sites
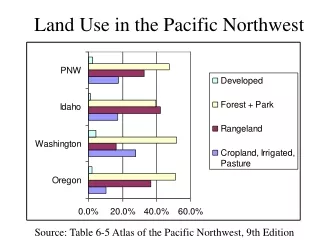
Percentage Land Use Class by Land Use Sub-Area
SM05 Chaparral/Forest Sites CP05 GB05
Carpinteria Creek (first storm) CP00 – outlet CP20 – commercial CP30 – residential GB04 – chaparral/ forest
Franklin Creek (first storm)