Download
1 / 15
160 likes | 270 Views
“Measuring the Information Economy”. www.oecd.org/sti/measuring-infoeconomy WITSA Public Policy Meeting hosted by BIAC 24 October 2002. ICCP’s Statistical Progress. 2001. 2002. 2000. ICT contribution to economic activity, still small but growing.

E N D
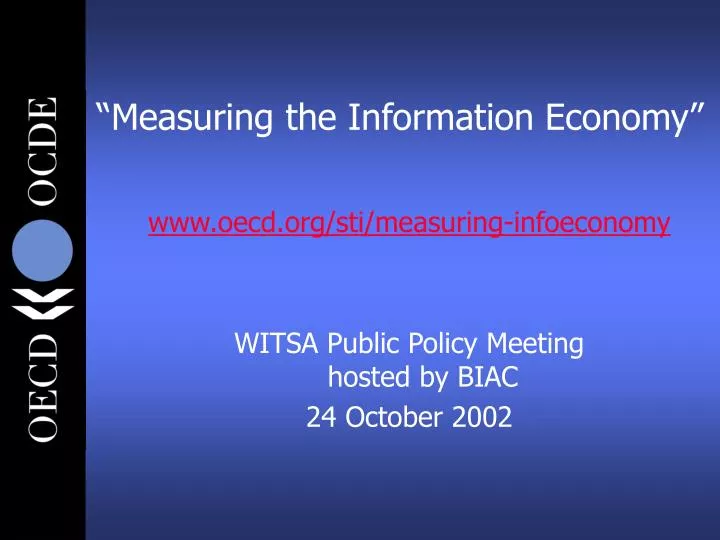
“Measuring the Information Economy” www.oecd.org/sti/measuring-infoeconomy WITSA Public Policy Meetinghosted by BIAC 24 October 2002
ICCP’s Statistical Progress 2001 2002 2000
ICT contribution to economic activity, still small but growing Share of ICT value added in business sector value added % 1995 2000 20 15 OECD 25 USA JAPAN EU 14 10 5 0 ITA ESP MEX NZL FIN NDL NOR SVK FRA CZE UK AUS BEL SWE AUT DNK IRL (99) GRE (99) DEU (99) KOR (99) PRT (99) CAN (98) HUN (99)
but who is the producer? Share of turnover of foreign affiliates in computer manufacturing (ISIC 30), 1998 % 100 80 60 40 20 0 Italy Finland Ireland France Hungary Kingdom Sweden Germany United Netherlands United States
… and who is the user? ICT investment, percentage of non-residential gross fixed capital formation, total economy % 40 1990 1980 2000 30 20 10 0 UK EU Spain Italy Japan France Austria Ireland USA Greece Canada Belgium Australia Finland Sweden Portugal Denmark Germany Netherlands
ICT contribution to innovation … Europe lagging behind ICT patents as a % of total national patents filed at EPO, for priority years 1990, 1998 % 45 1990 1998 30 Japan US OECD EU 15 0 IRL FIN NED PRT KOR IRL ESP BEL GRE ITA UK FRA AUT SWE CAN DNK NOR DEU
… and what about Internet access in households Households with access to Internet, 2000 Denmark United States Canada Sweden Netherlands United Kingdom 2001 Finland New Zealand 2000 Switzerland Japan Australia Germany Ireland Austria Italy Portugal France Belgium Turkey Mexico % 70 60 50 40 30 20 10 0
Individuals frequently using the Internet Individuals using the Internet Individuals using the Internet daily Individuals using the Internet at least once a week % 80 60 40 20 0 Italy UK Turkey Sweden Mexico Austria Finland France Canada Australia Denmark Netherlands
And businesses? Buying and selling over the Internet is not very common yet Businesses (+10) using the Internet % Businesses (+10) receiving orders over the Internet Businesses (+10) ordering over the Internet 100 80 60 40 20 0 Italy UK Spain Japan Portugal Sweden Canada Denmark Finland Greece Austria Australia Norway Netherlands Luxembourg New Zealand
and payment and delivery even less... Business using the Internet in trasaction-related business processes, 2000 sales receiving on-line payments delivery of digitised products % 30 25 20 15 10 5 0 Italy Austria Spain Greece Finland Denmark Portugal Norway Sweden Luxembourg Australia (2000-01)
Official estimates of Web, Internet and electronic commerce transactions. Percentage of total sales or revenues. Internet commerce still small …. BROADER 1.8% 5.20% (UK) (UK) 2.00% (Sweden) Business sector 0.40% (Canada) 13.30% (Sweden) (Australia, 1999-2000) 0.40% 0.90% 5.95% (UK) 0.94% (UK) (Denmark) Business sector (excluding 0.40% (Italy) financial sector) (Finland) 0.70% 1.04% 1.2% (UK) (USA, 4rd Q 2001) (Canada) (USA, 4th Q 2000) 0.40% 1.1% Retail sector 0.20% (France, 1999) (Austria) (UK) 0.10% 1.4% BROADER Web commerce Internet commerce Electronic commerce
mainly b-to-b transactions Share of Internet sales by type of customer, 2000 Luxembourg (1) Finland Canada Denmark (2) Households United Kingdom Public sector Sweden Enterprises Norway Public Sector and enterprises Austria (1) Portugal (1) Korea (3) Singapore 0% 20% 40% 60% 80% 100%
and mainly domestic Share of Internet sales in domestic and international markets, 2000 Abroad European Union Domestic Luxembourg Italy Sweden Denmark (2001) Spain Canada Norway Austria Finland United Kingdom 0% 20% 40% 60% 80% 100%
Businesses facing security issues by firm sizePercentage of computer users, 2000 % 10-49 50-249 250+ 70 60 50 40 30 20 10 0 Italy Spain Austria Finland Portugal Greece Sweden Denmark Luxembourg United Kingdom
Small and large businesses facing barriers to Internet payments Percentage of businesses using a computer % 45 10-49 50-249 250+ 10+ 40 35 30 25 20 15 10 5 0 ITA ESP AUT UK SWE GRE DNK LUX PRT FIN