Download
1 / 31
310 likes | 569 Views
Nutrients And Casco Bay. Notes from the Nutrient Council. Curtis C. Bohlen Director, Casco Bay Estuary Partnership. Reminder. Prior session on collaboration and monitoring This session more about future actions and policy Follow-up discussion with all three presenters New solutions

E N D
Nutrients And Casco Bay Notes from the Nutrient Council Curtis C. Bohlen Director, Casco Bay Estuary Partnership
Reminder • Prior session on collaboration and monitoring • This session more about future actions and policy • Follow-up discussion with all three presenters • New solutions • Future direction for Casco Bay • What lessons can be applied elsewhere in Maine?
Casco Bay Estuary Partnership • One of 28 National Estuary Programs • A 23 member LOCAL advisory board • Implement the “Casco Bay Plan” • Revised in 2016 • Credible data and information • We build consensus, facilitate communications and attract funds for protection of the Bay
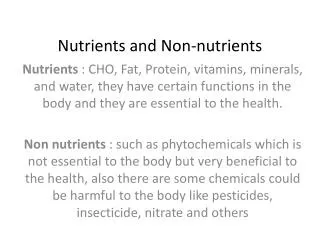
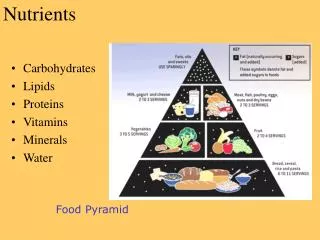
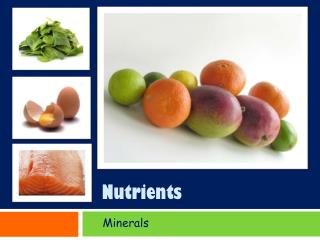
Nutrients (Maybe not what you think) • Ecologists use the term in a specific, technical way • NOT vitamins or healthy foods • Elements like carbon, nitrogen, phosphorus required to build living organisms • Nutrients of concern for coastal water quality generally include Nitrogen and Phosphorus
Too Much of a Good Thing • Excess nutrients can cause water quality problems • “Coastal Eutrophication” • Low or no dissolved oxygen • Algal blooms • Acidification • Loss of habitat • Reduced harvests
A Global Problem Breitburg1et al. 2018. Declining oxygen in the global ocean and coastal waters. Science359, Issue 6371, eaam7240. DOI: 10.1126/science.aam7240
Human Activity Increases • Population growth • More human waste • (Sub)urbanization • More stormwater • More atmospheric deposition (driving) • Agricultural production • Use of lawn chemicals • Loss of Forests and wetlands • Increase nutrient delivery Tree box filter maintenance
In Casco Bay • Few “dramatic” events like fish kills that raise public visibility • Subtle effects (coastal acidification) • Episodic events (algal overgrowth of tidal flats, algae blooms) • Hypothesized effects (eelgrass)
Problems likely to grow • Population growth and land use changes will increase loads • Climate change is likely to increase vulnerability • Warmer waters • More intense storms
Water Quality is Not Free • Portland’s CSO Plan • $170 million • Long Creek Watershed Management District • Public-private partnership • $14 million • ~ 2.3 square miles • just in the first decade. • East End WWTF nitrogen upgrade • ~ $40 million Portland waterfront Combined Sewer Overflow
Casco Bay Nutrient (Pollution) Council • Seek cost-effective solutions to nutrient pollution of Casco Bay • Membership: • Wastewater Treatment Facilities • Municipal staff • Environmental advocates • Academics • Engineers and scientists
The Council’s Work • Careful examination of the science • Document existing programs and efforts • Review of costs and cost effectiveness
What’s the “limiting nutrient” in Casco Bay? • “Limiting nutrient” plays a dominant role in affecting growth of marine phytoplankton • Nitrogen or Phosphorus? • Almost certainly nitrogen, most of the time • Most common limiting nutrient in inshore marine waters • Low ratios of N:P in the Bay
How close to a “Tipping Point”? • Hard to tell… • Nitrogen in parts of Casco Bay exceed levels with negative effects elsewhere • Impacts to eelgrass • TN > 0.32 mg/l • Low dissolved oxygen • TN > 0.45 mg/l
Nutrient Status • N Levels in parts of Casco Bay are among the highest in Maine • Exceed levels of concern for other Northeastern waters Source: CBEP State of the Bay 2015 Based on FOCB Data Geometric Mean TN. Sample Size Varies
Nitrogen Entering Casco Bay • ~ 1 million kg N annually (four models) • ~ 23 kg N per hectare annually • Low compared to other large estuaries in the NE Source: Latimer and Charpentier 2010;based on data from Whitall et al. 2007
Where’s it all coming from? Source: Castro et al. 2003
Too Many Models, Not Enough Data Developed Land does not include direct coastal drainage, but includes septic. Wastewater assumes design flows. • 1 million Kg N per Year • (+/- about 40%)
Three TributariesTotal Nitrogen Concentrations Data courtesy of Whitley Gilbert, University of Maine. 51 Observations May 2017-May 2018
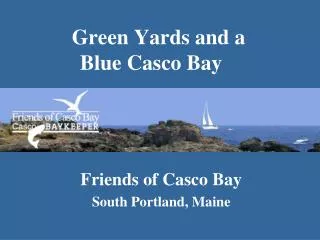
Issues are Local, not Baywide Data Provided by: Friends of Casco Bay Maine Department of Environmental Protection US Environmental Protection Agency
Impervious Cover 2007 • A measure of urbanization • Directly linked to runoff and water quality problems • Highest levels of imperviousness in sub watersheds • Portland, South Portland • Falmouth • Yarmouth • Freeport • Brunswick And Wastewater Treatment Facilities
High Frequency Monitoring 2019 PRELIMINARY DATA
Comparison to UMAINE Buoy Different sensor technology Different location - by EEWTF Similar pattern with rainfall
Investing in Clean Water • Resources are the challenge • Taxes, fees • Regulatory solutions impose costs on regulated entities • Often municipalities • Reduce costs • Cost-effectiveness analysis • Policy harmonization • Across permits • Across jurisdictions • Across levels of government
Cost Effectiveness • Multiple permits, multiple jurisdictions hinder ability to identify or implement cost-effective strategies • Regional conversations integrating policy, permitting and implementation across municipalities • Facilitate policy coordination between state and local government • “Integrated Planning” to look across permits, goals • Existing policies do little to favor cost-effective technologies for nitrogen removal https://www.blueportland.org/
The best “Best “Bang for the Buck”? • Protect wetlands, forests, and floodplains • Engage local government • Planning as though watersheds matter • Local ordinances • Encourage “Green Infrastructure” • Reduce costs • Policy innovation and flexibility may be needed to allow cost optimization
Alternative Investments….? • Atmospheric Deposition • Reduce vehicle emissions • Fuel efficiency, electric vehicles, transit, compact development…. • Reduce runoff • Protect forests, wetlands and floodplains • Implement better stormwater technologies • Invest in “retrofits” • Wastewater • Invest in better technologies • Address CSOs • Other Ideas? Source: Castro et al. 2003
Acknowledgements • Members of the Nutrient Council • Leadership and ideas • Tyler Walsh • Sumer intern and equipment wrangler extraordinaire. • Rachel Lasley-Rasher: • Lab space • Assistance with hazardous materials and other logistics • Sharing a fine crew of students and interns • Rachel Lasley-Rasher and Damian Brady • Providing intern Tyler Walsh for the summer • With funding through SEANET • Friends of Casco Bay • Managing data QA/QC Samples • South Portland Parks Department • Access to the Portland Street Pier • National Estuaries Program and Nutrient Sensor Action Challenge • Project funding
Sources • Data analysis using R • R Core Team (2019). R: A language and environment for statistical computing. R Foundation for Statistical Computing, Vienna, Austria. URL https://www.R-project.org/. • Graphic style based on the web comic xkcd by Randall Munroe • https://xkcd.com • Tools for graphics: • Ggplot2 library • H. Wickham. (2016) ggplot2: Elegant Graphics for Data Analysis. Springer-Verlag New York. • Available in many places online, including as part of the “tidyverse” of tools for modern data analysis workflows with R • https://www.tidyverse.org/ • xkcd library • Emilio Torres-Manzanera (2018). xkcd: Plotting ggplot2 Graphics in an XKCD Style. R package version 0.0.6. https://CRAN.R-project.org/package=xkcd • xkcdfonts • Several versions available online. The xkcd R library suggests • http://simonsoftware.se/other/xkcd.ttf • Two slightly different xkcd fonts, including the xkcd Script font are available here: • https://github.com/ipython/xkcd-font
Thank You Long Reach Lane Culvert Replacement Curtis Bohlen Director, Casco Bay Estuary Partnership cascobayestuary.org curtis.bohlen@maine.edu Nutrient Council Report Wordcloud