Download

1 / 11
110 likes | 273 Views
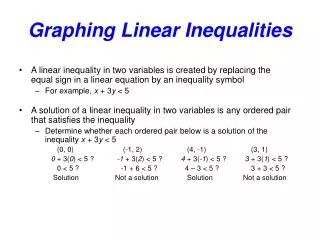
2.8 Graphing Linear Inequalities. Algebra 2 Mrs. Aguirre Fall 2013. Objectives. Graph linear inequalities in two variables. Introduction.

E N D
2.8 Graphing Linear Inequalities Algebra 2 Mrs. Aguirre Fall 2013
Objectives • Graph linear inequalities in two variables
Introduction • When graphing inequalities, the boundaries you draw may be solid or dashed. If the inequality uses the symbol ≥ or ≤ , which may include equality, the boundary will be solid. Otherwise, it will be dashed. After graphing the boundary, you must determine which region is to be shaded.
Introduction • Test a point on one side of the line. If the ordered pair satisfied the inequality, that region contains solutions to the inequality. If the ordered pair does not satisfy the inequality, the other region is the solution. • > or ≥ shade up • <or ≤ shade down
Graph y < 3. Graph y ≤ |x| Chalkboard examples
Graph Graph y < 3x +1 Chalkboard examples
Graph y ≥ |x| + 1 Graph 3x ≥ 4y Chalkboard examples
Ex. 1: Graph 2y – 5x ≤ 8. x-intercept y-intercept • The boundary will be the graph of 2y – 5x = 8. Use x and y intercepts to graph the boundary more easily. • Graph the x and y intercepts on a coordinate graphing plane. • Draw a solid line connecting these two intercepts. This is the boundary.
Now graph/shade • Now test a point. • Try (2,0) The region that contains (2, 0) should be shaded.
Ex. 2: Graph y > |x| - 1. When x ≥ 0 • The absolute value has two conditions to consider • y > -x – 1 When x < 0 y > -x -1 y > x -1 • Graph each inequality for the specified values of x. The lines will be dashed.
Now graph/shade • Now test a point. • Try (0,0) The region that contains (0, 0) should be shaded.