Download
1 / 30
300 likes | 394 Views
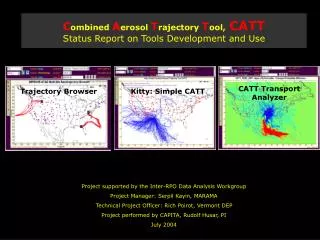
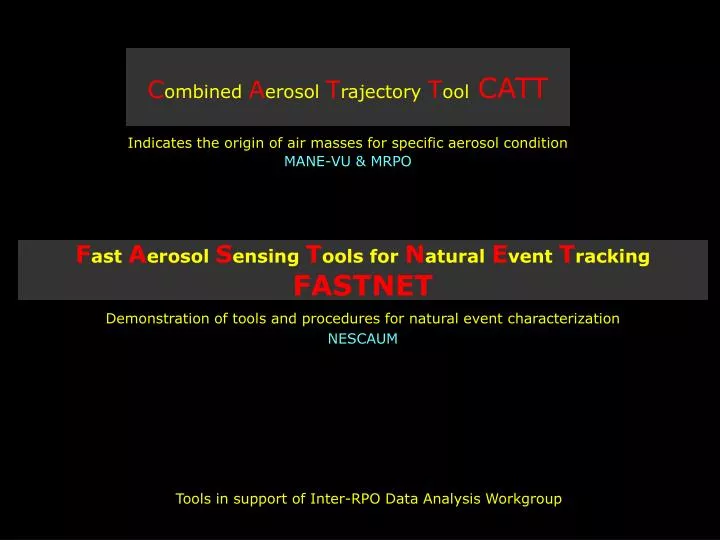
C ombined A erosol T rajectory T ool CATT. Indicates the origin of air masses for specific aerosol condition MANE-VU & MRPO. F ast A erosol S ensing T ools for N atural E vent T racking FASTNET. Demonstration of tools and procedures for natural event characterization NESCAUM.

E N D
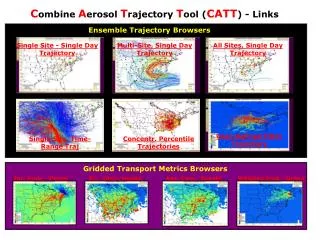
Combined Aerosol Trajectory ToolCATT Indicates the origin of air masses for specific aerosol condition MANE-VU & MRPO Fast Aerosol Sensing Tools for Natural Event Tracking FASTNET Demonstration of tools and procedures for natural event characterization NESCAUM Tools in support of Inter-RPO Data Analysis Workgroup
FASTNET:Inter-RPO pilot project, through NESCAUM, 2004Web-based data, tools for community useBuilt on DataFed infra-structure, NSF, NASAProject fate depends on sponsor, user evaluation
Data Providers Info System Info Users Public AIRNow AIRNow Model Manager Compliance Scientist DAACs Science • Current info systems are project/program oriented and provide end-to-end solutions • Part of the data resources of any project can be shared for re-usethrough DataFed • Through the Federation, the data are homogenized into multi-dimensional cubes • Data processing and rendering can then be performed through web services • Each project/program can be augmented by Federation data and services Sample AQ Information Usage Landscape
A Sample of Datasets Accessible through ESIP – DataFed MediationNear Real Time (~ day) It has been demonstrated (project FASTNET) that these and other datasets can be accessed, repackaged and delivered by AIRNow through ‘Consoles’ MODIS Reflectance MODIS AOT TOMS Index MODIS Fire Pix GOES AOT GOES 1km Reflec NEXTRAD Radar NWS Surf Wind, Bext NRL MODEL
Datasets Used in FASTNET Near Real Time Data Integration Delayed Data Integration Surface Air Quality AIRNOW O3, PM25 ASOS_STI Visibility, 300 sites METAR Visibility, 1200 sites VIEWS_OL 40+ Aerosol Parameters Satellite MODIS_AOT AOT, Idea Project GASP Reflectance, AOT TOMS Absorption Indx, Refl. SEAW_US Reflectance, AOT Model Output NAAPS Dust, Smoke, Sulfate, AOT WRF Sulfate Fire Data HMS_Fire Fire Pixels MODIS_Fire Fire Pixels Surface Meteorology RADAR NEXTRAD SURF_MET Temp, Dewp, Humidity… SURF_WIND Wind vectors ATAD Trajectory, VIEWS locs. • Data are accessed from autonomous, distributed providers • DataFed ‘wrappers’ provide uniform geo-time referencing • Tools allow space/time overlay, comparisons and fusion
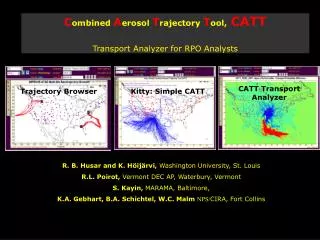
Some of the Tools Used in FASTNET • Data Catalog • Data Browser • PlumeSim, Animator • Combined Aerosol Trajectory Tool (CATT) Consoles: Data from diverse sources are displayed to create a rich context for exploration and analysis Viewer: General purpose spatio-temporal data browser and view editor applicable for all DataFed datasets CATT: Combined Aerosol Trajectory Tool for the browsing backtrajectories for specified chemical conditions
Aerosol Event Catalog: Web pages • Catalog of generic ‘web objects’ – pages, images, animations that relate to aerosol events • Each ‘web object’ is cataloged by location, time and aerosol type.
NRL NAAPS Aerosol Forecast Model Nitrate? NRL model Surface Bext Overlay Problem: humidity correction Aerosol Bext Data NAAPS SO4 Model
Origin of Fine Dust Events over the US Gobi dust in spring Sahara in summer Fine Dust Events, 1992-2003 ug/m3 Fine dust events over the US are mainly from intercontinental transport
Feb 19 2004: • Isolated high PM25 occurs over the Midwest, Northeast and Texas • The aerosol patches are evident in AIRNOWPM25, ASOS and Fbext maps • The absence of TOMS signal indicates the lack of smoke or dust at high elevation • The high surface wind speed over Texas, hints on possible dust storm activity • The NAAPS model shows high sulfate over the Great Lakes, but no biomass smoke • Possible event causes: nitrate in the Upper Midwest and Northeast, sulfate around the Great Lakes and dust over Texas
AEROSOL CATT-In CAPITA Aerosol Sensors Aerosol Data Integrated AerData TrajData Cube Aggreg.Aerosol Collection IMP. EPA Trajectory ARL Integration VIEWS Assimilate NWS CATT Weather Data Gridded Meteor. Traject.Data When? Where? Aggreg. Traject. Next Process AerData Cube CATT-In CAPITA Not There! Why? How? TRANSPORT Further Analysis Next Process GIS Grid Processing Emission Comparison There! CATT: A Community Tool! Part of an Analysis Value Chain
NOAA ARL ATAD ATAD Traject Gebhart (2002) Weather Serv. Upper Air Data CATT Tool Husar (2003) Aggregation Poirot (2003) PMF Tool Pareto (2001) PMF “Sources” Coutant (2002) NPS-CIRA IMPROVEData Direction of Dust Origin at 5 IMPROVE Sites High ‘dust’ concentration at 5 sites indicate the same airmass pathway from the tropical Atlantic Ad hoc Data Processing Value Chain
Sulfate Transport Pattern on 2004-07-20 All Data SO4 > 5 SO4 > 15
Sulfate Transport to BIBE, GRSM and LYBR All Data 80-100 Percentile 0-20 Percentile Big Bend, TX Great Smoky, TN Lynbrook, VT
Secular Changes: 1988-94; 1995-2000 1988-2000 1994-2000 1988-1994
FASTNET: Fast Aerosol Sensing Tools for Natural Event Tracking CATT: Combined Aerosol Trajectory Tools Web-Based Data Acquisition, Visualization, Analysis Tools, Developed by CAPITA (R. Husar, S. Falke, K. Hoijarvi), Funded by the 5 US Regional Planning Organizations, Managed for MANE-VU by Gary Kleiman & Serpil Kayin Based on Data Architecture Developed with previous support from NSF and NASA Found at http://datafed.net
Back Trajectories for All IMPROVE Sites on 7/7/02 Unweighted (top left), & color-weighted for OC (top right), SO4 lower right & Cl (lower left)
Episodes can have large influence on background estimates Quebec Fires July 2002 “Unknown Origins” 2000, 2001, 2002 Central American Fires, May 1998
“Unknown” PM2.5 Events at Chiracahua are Windblown Dust Fine Soil & Coarse Mass are uniquely high in Time & Space
GUMO, TX on 3/24/02 is also Clearly and Uniquely Impacted by Windblown Dust
FAST-CAT Plans: 2005 • MANE-VU Funding for Continuation & Enhancements • Update IMPROVE & ATAD data to CATT, as available • Add STN data & ATADs to CATT • Add “User File Submittal” Options to CATT & FASTNET • “User-Friendly” Screening/Aggregation tools to FASTNET • Add NASA Satellite Images & Data Products to FASTNET • EPA Support for “Advanced User Training” (train the trainers)
Have Tools; Need Users http://datafed.net