Download

1 / 29
320 likes | 565 Views
Role of GIS and Remote Sensing to Environment Statistics. Dozie Ezigbalike Data Management Coordinator African Centre for Statistics. A Definition.

E N D
Role of GIS and Remote Sensing to Environment Statistics Dozie EzigbalikeData Management CoordinatorAfrican Centre for Statistics
A Definition • Environment statistics are statistics that describe the state and trends of the environment, covering the media of the natural environment (air/climate, water, land/soil), the biota within the media, and human settlements. • UNSD. 1997. Glossary of Environment Statistics, Studies in Methods, Series F, No. 67
Scope • Depends on: • Perception of major users and producers • Socioeconomic and environmental policies • Specific to particular conditions
Integrative • Environment Statistics bring together: • Human activities • Natural events • Impacts of activities and events on environment • Social responses to impacts • Quality and availability of natural assets
Interdisciplinary Modelling Problems • Interdisciplinary nature calls for synthetic presentation of data from various subject areas and sources • Characteristics of databases from various disciplines differ, specific examples for bio-physical databases: • Environmental variables based on scientific readings from instruments • Map data from ground surveys and remote sensing imagery • Sampling frameworks based on spatial rather than population distributions
Framework vs System • Environment statistics do not lend easily to “system” modelled on entities and bookkeeping, such as SNA • Instead, framework in the form of a logical structure for organizing information • Framework for development of environment statistics
Approaches • Media approach: organizes environmental issues from the perspective of the major environmental components of air, land, water, and the human-made environment • Stress-response approach: focuses on impacts of human intervention with the environment (stress) and the environment's subsequent transformation
Approaches … • Resource accounting approach: aims at tracing the flow of natural resources from their extraction from the environment, through successive stages of processing and final use, to their return to the environment as waste or to the economy for recycling • Ecological approach: include a variety of models, monitoring techniques and ecological indices in a broad field that could be characterized as "statistical ecology" or "ecological statistics"
FDES • A Framework for the Development of Environment Statistics • Combines media and stress-response approaches • Developed by UNSD in 1984 • Endorsed by StatCom in 1995 • Relates components of the environment to information categories
GIS for Visual Presentation • Environmental phenomena are location-based and better presented as maps • Compare:
GIS for Richer Content • Now compare last map of % of forest cover with actual vegetation cover • Richer content for more detailed analyses • GIS provides better data modelling for environmental phenomena
Points: Earthquake locations • Location of each point stored in GIS • Attributes of each point stored in relational database • E.g., date, magnitude, damage, fatality, etc.
Pin Maps • “Pins” are placed at the point locations and attributes from the database are displayed on clicking the pin symbol • Pins may be symbolized by attribute to present at-a-glance information
GIS for Data combinaton • Even though FEDS organizes data in categories, we still need to combine and integrate them for visualization and policy analysis • Common criterion for selection of data for such combination is location • Therefore we need a tool that can select and combine data on the basis of the location • Geographic Information System (GIS)
Forest - Deciduous Forest - Coniferous Scrub / Shrub Grasslands Barren/Sparsely Vegetated Urban / Built up Agriculture - Rice Fields Agriculture - Other Wetlands Wetlands - Mangroves Water Ice/Snow No Data / Clouds / Shadows Final Enlargement!!
Remote Sensing • But how do we collect the surface characteristics from every point for these detailed analyses?
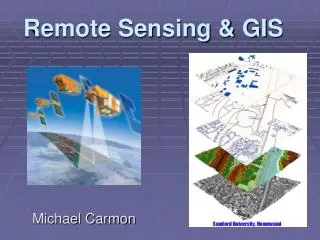
Satellites can detect a wide range of reflected or emitted frequencies of electromagnetic radiation. http://rst.gsfc.nasa.gov/Intro/Part2_1.html
Data indicating different amounts of reflected radio waves can be used to generate a “false color image” of rates and types of precipitation. http://www.google.com/webhp?hl=en
Remote sensing for more detailed data capture • EvapoTransportation
Analysis and Modelling • With detailed location specific data, we can now use the power of to answer complex spatial queries and what if …? Scenarios
Very High (Stress) Very Low (Stress) Food Security Modeling using Landcover Total Potential Food Supply Africa Geospatial I&W: Regions at Risk Population (Food-Water) Risk Surface Water Vulnerability (food + water vulnerability) x (capacity) GeoCover LC Integrated into each model Capacity
To Conclude • Remote sensing allows the collection of detailed data about bio-physical characteristics that cannot be collected by questionnaires • GIS allows the data, even questionnaire data to be visualized graphically • It allows the combination of data based on their location • And the complex combination for analyses