Download
1 / 62
640 likes | 676 Views
Explore Earth's environment, climate change, remote sensing, geographic information systems, and geomatics applications. Learn about atmospheric layers, greenhouse gases, and GIS functionalities.

E N D
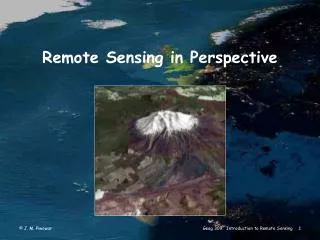
Global Effects – Remote Sensing and GIS Lecture #24 HNRT 228 Spring 2016 Energy and the Environment Adapted from Fiorentino / Rutgers U.
Chapter 10+ Overview • Earth as a planet • The polar regions and sea ice effects • The stratospheric ozone situation • Another look at greenhouse gasses • Climate change • Global warming • Remote Sensing • Geographic Information Systems • Geomatics
iClicker Question Which of the following layers of the atmosphere is highest above the surface of the Earth? A Troposphere B Stratosphere C Thermosphere D Mesosphere E Ozone Layer
iClicker Question What is the primary ingredient of the Earth's atmosphere? A Nitrogen B Oxygen C Nitrogen and oxygen in equal parts D Hydrogen E Carbon dioxide
iClicker Question In what part of the atmosphere does weather occur? A Hydrosphere B Stratosphere C Ionosphere D Troposphere E All of the above
iClicker Question How rapidly a planet loses its atmosphere depends on the planet's • I. mass • II. atmospheric composition • III. temperature • IV. rotation period A I & II B III & IV C I, II, & III D II, III, & IV E I, II, III, & IV
iClicker Question The presence of Earth’s magnetic field is a good indication that A there is a large amount of magnetic material buried near the North Pole. B there is a quantity of liquid metal swirling around in the Earth's core. C the Earth is composed largely of iron. D the Earth is completely solid. E there are condensed gasses in the core of the Earth.
The dinosaurs were most likely wiped out by: A: disease B: hunting to extinction by cavemen C: a giant meteor impact D: the close passage of another star iClicker Question:
A leading cause of Global Warming is: A: Increased soot (smog) in the atmosphere. B: Increased carbon dioxide in the atmosphere. C: The Earth is getting closer to the sun. D: The luminosity of the sun is steadily increasing. iClicker Question:
The greenhouse gas effect would not occur if A the Earth had no atmosphere. B: the amount of carbon dioxide doubled. C we got rid of all the forests. D the Earth didn’t have an ocean. iClicker Question:
Sunlight absorbed by the Earth’s surface is reemitted in the form of? A: radio waves B: infrared radiation C: visible radiation D: ultraviolet radiation E: X-ray radiation iClicker Question:
Geomatics refers to earth (geo) measuring (matics) technologies…the discipline of gathering, storing, processing, and delivering of geographic information. This broad term applies both to science and technology, and integrates the following more specific disciplines and technologies: geodesy, surveying, mapping, positioning, navigation, cartography, remote sensing, photogrammetry, geographic information systems, & global positioning systems source: http://en.wikipedia.org/wiki/Geomatics Organize and solve problems involving spatial analysis – still typically just called GIS (geographic information systems)
Data and Information • To some: Information is not Data • Data needs to be transformed into information (and vice versa) • Information can be defined as an answer to a question using data –or– • Information is what we know that must be organized into data for use in analysis With GIS we transform information into data
Geomatics or More Commonly GISRemote Sensing Image Process Air Photo Satellite Images Photogrammetry Raster GIS Vector GIS 3D Modeling GPS GIS Visualization Networking Databases Internet
Policy Transportation Demography Global environment Wildlife management Business Regional and Urban Planning Defense and Intelligence Forestry Archaeology Natural resource management Water/soils/agriculture Telecommunications Emergency Response ANY problem that has a spatial aspect ANY scale from the local to the global Geomatics has application in: “Applied Geography, in the form of maps & spatial information has served discovery, planning, cooperation & conflict for at least the past 3000 years” Bolstad
Collect Manage Manipulate Analyze Display FIVE major functions Inherent to Geomatics
Primary Disciplines of Geomatics • Geographic Information Systems (GIS) • Remote Sensing • Air photo • Satellite imagery • Global Navigation Satellite Systems (GNSS) • More commonly called GPS for Global Positioning Satellite [System]
“…a computer based system to aid in the collection, maintenance, storage, analysis, output, and distribution of spatial data and information…” Geographic Information System
Why GIS? • Expanded capabilities - do it with a geographic twist • Improved efficiency - reduce duration of analysis 10-fold or more
What is GIS? • Paper, pencil, and person can be a GIS
Why computerize manual methods? • Synthesis of sources • Analytical power • Measure distance, density, area • Overlay and buffer • Adjacency and proximity • Vicinity (neighborhood) • Networks • Inter-visibility • Interoperability • Flexibility • Repeatability • Output Quality
Geographic Data describing objects from the real world in terms of: • Position (x,y in some coordinate system) • Spatial relationships • Streets may be “connected” • There is a distance between two points • Areas overlap, be adjacent or not touch
Information • Organized knowledge about locations facilitates analysis and new knowledge • Predictable data “schema” …compared to paper maps stored in different rooms in different drawers, at different scales and projections (time consuming and sometimes impossible to analyze)
Systems • Consistent storage in a database • Retrieve and manipulate information in a consistent manner • Flow of data can be documented • Spatial data from a variety of sources, scales and projections can be converted into one logical structure allowing access and analysis using a set of rules
Abstracting the Real World Abstraction of relevant phenomena and properties Phenomena that Exist Computer Representation
GIS exists in an institutional context… Effective GIS use depends on a set of protocols and an integration into the data collection, analysis, decision, and action loop of an organization
GIS Data Examples If it can be mapped it can be entered into a GIS • Pointsarcheological sites, trees, fire hydrants, crime locations, cellular towers, etc. • Linesroads, streams, political boundary lines • Polygonsarcheological sites, soils, geology, vegetation cover, watersheds, political subdivisions
"GIS is simultaneously the telescope, the microscope, the computer, and the Xerox machine of regional analysis and synthesis of spatial data." (Abler, 1988)
GIS Data TABULAR ATTRIBUTE DATA SPATIALREFERENCE
GIS Data • Hydrology • Soils • Roads • Elevation • Land use / land cover (from satellite imagery or air photos) • The landscape (in all its complexity) Each type of data forms a data layer that is geo-referenced to a common map projection and datum
REPRESENTATION AND DATA STRUCTURES Most commondata models define thematic layers Typically there is one layer for each distinct theme
GIS - The Concept of Layers Assessment of Soil Erosion Hazard DERIVED DATA ANALYSIS LAND DATA Ownership Class Slope Hydrology Erodability Potential Soil Erosion Runoff Topography Soils Land Cover Base Map
A Forest Area…. Delineated to make patches Create Ranked Critical Areas Overlaid with Species Data to…
Digitize Maps Digitize & Classify Imagery Input Existing Spatial Files Input Tabular Data A GIS Schematic Manipulate & Analyze Collect Manage Display Spatial Processing System MAP OUTPUTS Composite Maps Perspective Maps Interpret Maps Scaled Maps Spatial Data Base Non Spatial Resource Data Base • Area • Lengths • Data Base Summaries Data Base Management System TABULAR AND STATISTICAL INFO
Policy Transportation Demography Global environment Wildlife management Business Regional and Urban Planning Defense and Intelligence Forestry Archaeology Natural resource management Water/soils/agriculture Telecommunications Emergency Response ANY problem that has a spatial aspect ANY scale from the local to the global GIS is Generic “Applied Geography, in the form of maps & spatial information has served discovery, planning, cooperation & conflict for at least the past 3000 years” Bolstad
Policy Education Cartography Hazards – EMS, first responders Hydrology Land Resources Zoning Use value Taxation Transportation Environmental impact assessment Parks and forest management Planning Agriculture Soils management Marketing Global environmental issues Demographics Wildlife management Route selection Civil engineering Network analysis – e.g. telecom Public health Toxic waste management Archaeology and history Police, fire, 911, emergency Oil and other toxic spills Landscape architecture Many, many others, and more to come Some GIS Applications Areas
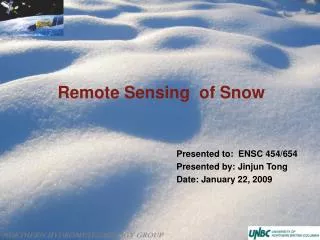
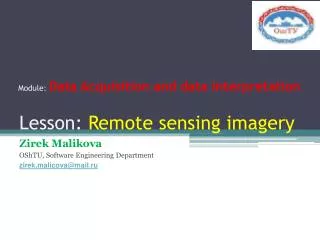
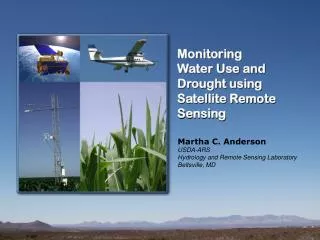
Remote Sensing “Remote sensing is the science and art of obtaining information about an object, area, or phenomenon through the analysis of data acquired by a device that is not in contact with the object, area, or phenomenon under investigation.” Lillesand & Kiefer (1987)
Remote Sensing Platforms • Geostationary • Polar orbit • Manned space • High altitude aircraft • Jets • low alt. aircraft • Platforms • In-situ/ground 30000 km 1000 km 300 km 90,000 ft 10-30,000 ft 500-10,000 ft 10-100 ft 0-5 ft
Air photos have been a major source of information for making maps
Air Photos • High resolution • Since 1930’s (for change detection) • Provide most cadastral, utility and infrastructure data for GIS
Cranberry Beds Drainage Tiles Reservoirs Disease Color infrared aerial photograph, July, 1999 Source: Ocean Spray Cranberries Inc. Precision Agriculture and Disease Detection
Phosphorus Distribution Nitrogen Distribution Managing Nutrient Input/Run-off into Watersheds
Satellite Imagery (temporal analysis) Banda Aceh, Indonesia (source: DigitalGlobe)
The Nature of an “Image” • A remotely sensed image is not considered a photograph • An image is a rendition (or model) of target features described through the use of spectral reflectance • These reflectance values are stored in a quantitative, numerical fashion in a manner suitable for input to a computer
…the electromagnetic spectrum • Note: The EM spectrum is arbitrarily segmented into major divisions • There are no natural breaks in the EM spectrum • Humans created the separations for our own convenience
Electromagnetic Radiation • Electromagnetic radiation (EM) is the signal collected by most remote sensing instruments • The source of the energy varies depending on the sensor characteristics • Most systems rely on the sun to generate all the EM energy needed to image terrestrial surfaces (passive sensors) • Other systems (active sensors), transmit energy in a certain direction and record the portion reflected back by features within the signal path
Remote Sensing Topics • Radiation Laws • Light Interactions with Atmosphere • Scatter, Absorption, Windows • Interaction of Light with Surface • Spectral signatures, reflection, transmission, illumination • Land Observation Satellite Systems • AVHRR, Landsat, MSS, TM, SPOT • Digital Image Analysis vs. Photo Interpretation