Download
1 / 18
180 likes | 261 Views
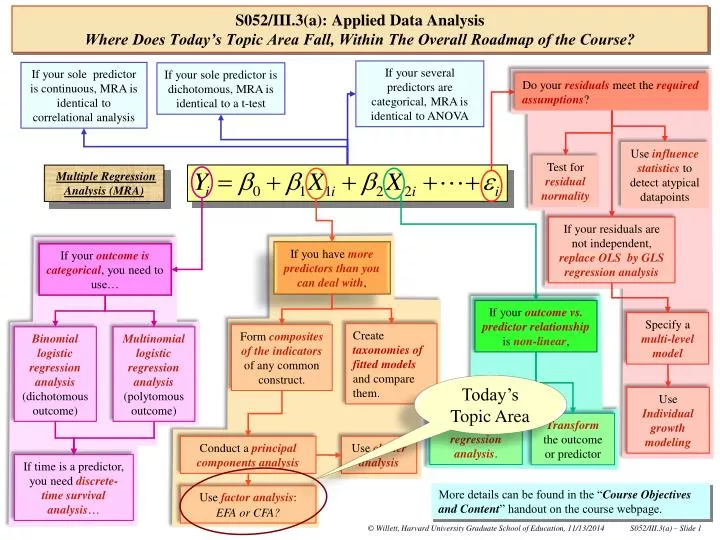
If your several predictors are categorical, MRA is identical to ANOVA. If your sole predictor is continuous, MRA is identical to correlational analysis. If your sole predictor is dichotomous, MRA is identical to a t-test. Do your residuals meet the required assumptions ?.

E N D
If your several predictors are categorical, MRA is identical to ANOVA If your sole predictor is continuous, MRA is identical to correlational analysis If your sole predictor is dichotomous, MRA is identical to a t-test Do your residuals meet the requiredassumptions? Use influence statistics to detect atypical datapoints Test for residual normality Multiple Regression Analysis (MRA) If your residuals are not independent, replace OLS byGLS regression analysis If you have more predictors than you can deal with, If your outcome is categorical, you need to use… If your outcome vs. predictor relationship isnon-linear, Specify amulti-level model Create taxonomies of fitted models and compare them. Form composites of the indicators of any common construct. Binomiallogistic regression analysis (dichotomous outcome) Multinomial logistic regression analysis (polytomous outcome) Today’s Topic Area Use Individual growth modeling Use non-linear regression analysis. Transform the outcome or predictor Conduct a principal components analysis Use cluster analysis If time is a predictor, you need discrete-time survival analysis… More details can be found in the “Course Objectives and Content” handout on the course webpage. S052/III.3(a):Applied Data AnalysisWhere Does Today’s Topic Area Fall, Within The Overall Roadmap of the Course? Use factor analysis: EFA or CFA?
S052/III.3(a):Applied Data AnalysisHow Does Today’s Topic Map Onto The Printed Syllabus? Measuring Teacher Professional Defensiveness (Slides 4-6). Contrasting Principal Components Analysis and Factor Analysis (Slide 8-9). How Ridiculous Is Exploratory Factor Analysis? (Slide 11). How Sensible is Confirmatory Factor Analysis? (Slide 13-17). Please check inter-connections among the Roadmap, the Daily Topic Area, the Printed Syllabus, and the content of today’s class when you pre-read the day’s materials. If you had an infinite number of monkeys …
S052/III.3(a):Applied Data AnalysisHow Does Today’s Topic Map Onto The Printed Syllabus? Measuring Teacher Professional Defensiveness (Slides 4-6). Please check inter-connections among the Roadmap, the Daily Topic Area, the Printed Syllabus, and the content of today’s class when you pre-read the day’s materials. If you had an infinite number of monkeys …
Construct Validation: • A New Instrument to Measure • Teacher Professional Defensiveness • Three Sub-Scales, each with 7 items: • “Criticisms” • “Compliments” • “Neutral” • Research Objective: • Check that three sub-scales of TPDS are each separately uni-dimensional. • Check that the constructs measured by each sub-scale are distinct from each other (but perhaps correlated). • Validate the TPD sub-scales against other accepted measures (SITS, FNES). S052/III.3(a):Applied Data AnalysisMeasuring Teacher Professional Defensiveness
Indicators of Teacher Professional Defensiveness: “Criticisms” Sub-Scale S052/III.3(a):Applied Data AnalysisMeasuring Teacher Professional Defensiveness Indicators of Teacher Professional Defensiveness: “Compliments” Sub-Scale
Teachers responses to the items on the Criticisms sub-scale average out to the middle of the available scale. Teachers’ responses to the items on the Criticisms sub-scale display considerable, yet homogeneous, variability. Let’s focus first on the “Criticisms” subscale of Teacher Professional Defensiveness… MeanStd DevMinimumMaximum 3.18844 1.06332 1.00000 7.00000 3.17085 1.03634 1.00000 7.00000 3.22362 1.09854 1.00000 7.00000 3.67588 1.08248 1.00000 7.00000 3.27136 0.92365 1.00000 7.00000 VariableLabel D5 Not clear how lesson related to curriculum standards. D10 Task didn’t help kids achieve your objective. D11 You like to worry about whether students like you. D14 Wonder if students learned concepts through hands-on lesson. D16 Wonder if students understand your sarcasm. S052/III.3(a):Applied Data AnalysisMeasuring Teacher Professional Defensiveness: “Criticisms” Sub-Scale Pearson Correlation Coefficients, N = 398 (Estimated under listwise deletion) D5 D10 D11 D14 D16 D5 1.000 D10 0.538 1.000 D11 0.372 0.477 1.000 D14 0.386 0.555 0.328 1.000 D16 0.356 0.483 0.342 0.436 1.000 • All the sample bivariate correlations among the indicators on the “Criticisms” sub-scale are: • Positive, • Approximately equal, • Moderate in size. • Sub-scale could indeed be uni-dimensional?
S052/III.3(a):Applied Data AnalysisHow Does Today’s Topic Map Onto The Printed Syllabus? Contrasting Principal Components Analysis and Factor Analysis (Slide 8-9). Please check inter-connections among the Roadmap, the Daily Topic Area, the Printed Syllabus, and the content of today’s class when you pre-read the day’s materials. If you had an infinite number of monkeys …
Rather than asking … “Can we forge these several indicators together into a smaller number of composites with defined statistical properties?” We could ask … “Are there A number of unseen (latent) factors (constructs) that act “beneath” these indicators to determine their observed values?” Then, we would need … Principal Components Analysis (PCA) Instead, we would need … Factor Analysis (CFA or EFA) Research Question? S052/III.3(a):Applied Data AnalysisContrasting PCA and Factor Analysis? Path Modelof Factor Analysis Path Modelof Principal Components Analysis 5i D5i D5i C1i 1i 10i D10i D10i C2i 11i D11i C3i D11i C4i 14i 2i D14i D14i C5i 16i D16i D16i C6i
Statistical Model For Principal Components Analysis … For Factor Analysis … S052/III.3(a):Applied Data AnalysisContrasting PCA and Factor Analysis? Given the X’s, pick the a’s, & compute the PC’s … this is the “Eigenvalue” problem, solved!!! Given the X’s, guess the ’s, guess the ’s, compute the ’s ... problem that can’t be solved!!! Unambiguous Set of Orthogonal Composites Infinite Number of Equally Reasonable Answers Given the data, the answer is determined by the method-- and there are thousands of different methods of Exploratory Factor Analysis… The answer is determined completely by the data
S052/III.3(a):Applied Data AnalysisHow Does Today’s Topic Map Onto The Printed Syllabus? How Ridiculous Is Exploratory Factor Analysis? (Slide 11). Please check inter-connections among the Roadmap, the Daily Topic Area, the Printed Syllabus, and the content of today’s class when you pre-read the day’s materials. If you had an infinite number of monkeys …
And, if you don’t believe me … look at the options you could face when conducting an Exploratory Factory Analysis … • Ways Of Rotating To A Final Factor Solution: • Biquartimax • Equamax, • None, • Orthogonal Crawford-Ferguson, • Generalized Crawford-Ferguson, • Orthomax, • Parsimax, • Quartimax, • Varimax. • Biquartimin, • Covarimin, • Harris-Kaiser Ortho-Oblique, • Oblique Biquartimax, • Oblique Equamax, • Oblique Crawford-Ferguson, • Oblique Generalized Crawford-Ferguson, • Oblimin, • Oblique Quartimax, • Oblique Varimax • Procrustes, • Promax, • Quartimin, … etc. *----------------------------------------------------------------------- * Exploratory factor analysis of TPD "Criticisms" sub-scale, on its own *----------------------------------------------------------------------- factor D5 D10 D11 D14 D16, pfmineigen(1) factor D5 D10 D11 D14 D16, pcfmineigen(1) factor D5 D10 D11 D14 D16, ipfmineigen(1) factor D5 D10 D11 D14 D16, ml mineigen(1) S052/III.3(a):Applied Data AnalysisHow Ridiculous Is Exploratory Factor Analysis? • Ways of Obtaining an “Initial” Factor Solution(of either the covariance or the correlation matrix): • Alpha factor analysis, • Harris component analysis, • Image component analysis, • ML factor analysis, • Principal axis factoring, • Pattern, specified by user, • Prinit factor analysis, • Unweighted least-squares factor analysis. • Ways Of Obtaining Initial Estimates Of The Measurement Error Variances: • Absolute SMC, • Input from external file, • Maximum absolute correlation, • Set to One, • Set to Random, • SMC. ( ) #of Methods of EFA …at least = 2 22 = 1848 7 6
S052/III.3(a):Applied Data AnalysisHow Does Today’s Topic Map Onto The Printed Syllabus? How Reasonable Is Confirmatory Factor Analysis? (Slide 13-17). Please check inter-connections among the Roadmap, the Daily Topic Area, the Printed Syllabus, and the content of today’s class when you pre-read the day’s materials. If you had an infinite number of monkeys …
A better approach – rather than sifting among millions of equally likely solutions with EFA … … is to make a reasonable hypothesis about the underlying factor structure and test whether it fits the data! Hypothesized Uni-Dimensional Factor Structure for the “Criticisms” Sub-Scale… 5i H0: Indicators of the “Criticisms” Sub-Scale Have a “Uni-Dimensional” Factor Structure, In The Population. D5i S052/III.3(b):Applied Data AnalysisHow Reasonable Is Confirmatory Factor Analysis? 10i D10i 11i 1i D11i 14i D14i *---------------------------------------------------------------------- * Confirmatory factor analysis of TPD "Criticisms" sub-scale *---------------------------------------------------------------------- * Inspect values of Criticisms for first 35 teachers in dataset: list D5 D10 D11 D14 D16 in 1/30, nolabel * Univariate descriptive statistics on teacher satisfaction indicators: tabstat D5 D10 D11 D14 D16, /// stats(mean sd n) col(statistics) casewise format(%6.0g) * Bivariate relationships among items on "Criticisms" sub-scale; pwcorr D5 D10 D11 D14 D16, casewise sig obs * CFA of "Criticisms" sub-scale: Testing a uni-dimensional hypothesis: confa (ETA1: D5 D10 D11 D14 D16), from(smart) 16i D16i See Data-Analytic Handout III.3(b).1
And, you know what? … it fits!!! H0: Indicators of the “Criticisms” Sub-Scale Have a “Uni-Dimensional” Factor Structure, In The Population. Fitted Uni-Dimensional Factor Structure for the “Criticisms” Sub-Scale… Chi-Square Statistic 9.3383 Chi-Square DF 5 Pr > Chi-Square 0.0947 D5i 0.64 S052/III.3(b):Applied Data AnalysisHow Reasonable Is Confirmatory Factor Analysis? 1.00 D10i 0.26 1.34 1i D11i 0.81 0.92 1.06 0.70 D14i 2 statistic for testing the null hypothesis of fit. Degrees of freedom for the test. Since the p-value is greater than .05, do not reject H0… we conclude that the data are consistentwith hypothesized path model. Note: These are the estimated error variances. 0.82 D16i 0.57 p-value for the test.
For “Compliments” Sub-Scale too!!!! H0: Indicators of the “Compliments” Sub-Scale Have a “Uni-Dimensional” Factor Structure, In The Population. Fitted Uni-Dimensional Factor Structure for the “Compliments” Sub-Scale… Chi-Square Statistic 8.361 Chi-Square DF 2 Pr > Chi-Square 0.0153 D6i 0.30 1.00 S052/III.3(b):Applied Data AnalysisHow Reasonable Is Confirmatory Factor Analysis? D13i 0.52 1.01 2i D18i 0.72 0.91 Since the p-value is greater than .01 (!!!), do not reject H0… we conclude that the data are consistentwith hypothesized path model. Statistics for testing the null hypothesis of fit. Note: These are the estimated error variances. 1.04 0.27 D21i
It doesn’t work quite so well, when you try to fit a two-factor (oblique) structure to all the indicators together!!! H0: Indicators of the “Criticisms” & “Compliments” Sub-Scales Have an Oblique Two-Factor Structure, In The Population. Hypothesized Oblique Two Factor Structure… 5i D5i S052/III.3(b):Applied Data AnalysisHow Reasonable Is Confirmatory Factor Analysis? 10i D10i Chi-Square Statistic 59.638 Chi-Square DF 26 Pr > Chi-Square 0.0002 11i D11i 1i 14i D14i 16i D16i 5i D6i 10i D13i 2i Since the p-value is less than .05, reject H0… we conclude that the data are not consistentwith hypothesized oblique two-factor structure. Statistics for testing the null hypothesis of fit. 11i D18i 14i D21i
Why? Because some of the indicators wants to load on the other factor, too … H0: Indicators of the “Criticisms” & “Compliments” Sub-Scales Have an Oblique Two-Factor Structure, In The Population, But Each Measures Both Factors. Hypothesized Oblique Two Factor Structure… 5i D5i Chi-Square Statistic 48.833 Chi-Square DF 23 Pr > Chi-Square 0.0013 S052/III.3(b):Applied Data AnalysisHow Reasonable Is Confirmatory Factor Analysis? 10i D10i 11i D11i 1i 14i D14i 16i D16i 5i D6i 10i D13i Since the p-value is less than .05, reject H0… we conclude that the data are not consistentwith hypothesized oblique two-factor structure, in the path model at the left … what next? 2i Statistics for testing the null hypothesis of fit. 11i D18i 14i D21i
If your several predictors are categorical, MRA is identical to ANOVA If your sole predictor is continuous, MRA is identical to correlational analysis If your solepredictor is dichotomous, MRA is identical to a t-test Do your residuals meet the required assumptions? Use influence statistics to detect atypical datapoints Test for residual normality Multiple Regression Analysis (MRA) If your residuals are not independent, replace OLS byGLS regression analysis If you have more predictors than you can deal with, If your outcome is categorical, you need to use… If your outcome vs. predictor relationship isnon-linear, Specify a Multi-level Model Create taxonomies of fitted models and compare them. Form composites of the indicators of any common construct. Binomiallogistic regression analysis (dichotomous outcome) Multinomial logistic regression analysis (polytomous outcome) Use Individual growth modeling Use non-linear regression analysis. Transform the outcome or predictor Conduct a Principal Components Analysis Use Cluster Analysis If time is a predictor, you need discrete-time survival analysis… More details can be found in the “Course Objectives and Content” handout on the course webpage. S052/III.3(a):Applied Data AnalysisIt’s Not The Destination, Grasshopper, It’s The Journey!!! (It’s Getting Very Near) The End (We Hope You Have Enjoyed The Show) Use Factor Analysis: EFA or CFA?