Download
1 / 14
140 likes | 249 Views
School Improvement & Accountability Update for P.S. Jones Middle. Presented by: Tracey Nixon Principal. School Profile. 806 Students 38% Black 45 % White 14% Hispanic 3% Other 15.2% (121 students) EC 65% are economically disadvantaged. Teacher Profile. 60 certified staff members

E N D
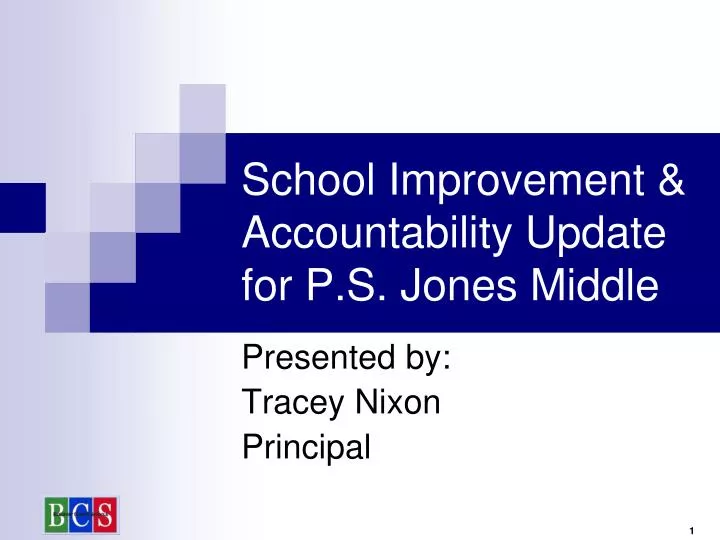
School Improvement & Accountability Update for P.S. Jones Middle Presented by: Tracey Nixon Principal
School Profile • 806 Students • 38% Black • 45 % White • 14% Hispanic • 3% Other • 15.2% (121 students) EC • 65% are economically disadvantaged
Teacher Profile 60 certified staff members 20 Classified 18% advanced degrees (22 Master Degrees, Two 6 year Advanced Degrees) 2 National Board Certified Experience 0-3 (15%), 4-10 (28.4%), and 10+ (56.6%)
Current Status* (2010-2011) *School overall composite and status for the 2010-2011 school year. **Percentage of schools in NC making AYP with the same number of AYP Target Goals as our school.
Sub-Groups Not Making AYP • Reading • All/Hispanic/LEP • Math • All/Black/Hispanic/EDS/SWD • 24 out of 29 subgroups met AYP
Current Status* (2010-2011) Math EOG Scores Grades 6-8
Current Status* (2010-2011) Reading EOG Scores Grade 6-8
Key Improvement Strategies • Professional Learning Communities • Change in Teacher Placement • 15 teachers shifted grade levels. Changes were based on EOG scores. • Positive Behavior Intervention and Support • Accel Enrichment Period • SRA Corrective Reading • ClassScapes
Key Improvement Strategies • Pamlico Pals Group Mentoring • Parental Involvement Nights • Differentiated Instruction • Reading Foundations (Exceptional Teachers) • Lexile Reading Program • EVAAS Data to schedule students (math) • Dynamic Demons - Male teacher mentors – at-risk AA students
Expected Results • PSJ will be designated as a School of Progress or higher • All grade levels will make Expected Growth or higher • PSJ will make AYP
Expected Results • 6th grade will improve their reading proficiency average 8% to get to the state average • 7th grade will improve their reading proficiency average 14% to get to the state average • 8th grade will improve their reading proficiency average 6% to get to the state average
Expected Results • Each grade level will be 80% proficient in Math • Percentage of students making growth in math and reading at all grade levels will increase by 10% • 8th grade science will improve the proficiency average 10% to move from 65% to 75% • PSJ will continue to be awarded an “Exemplar School” for our PBIS behavior system
PSJ Celebrations Designated as a School of Progress for 2010-11 Made high growth in 8th grade math Algebra students were 98% proficient 8th grade science scores increased 6.4% Designated as an Exemplar School by NCPDI for PBIS Overall discipline referrals decreased (1752 in 09/10 to 1391 in 10/11)