Download
1 / 98
980 likes | 1.09k Views
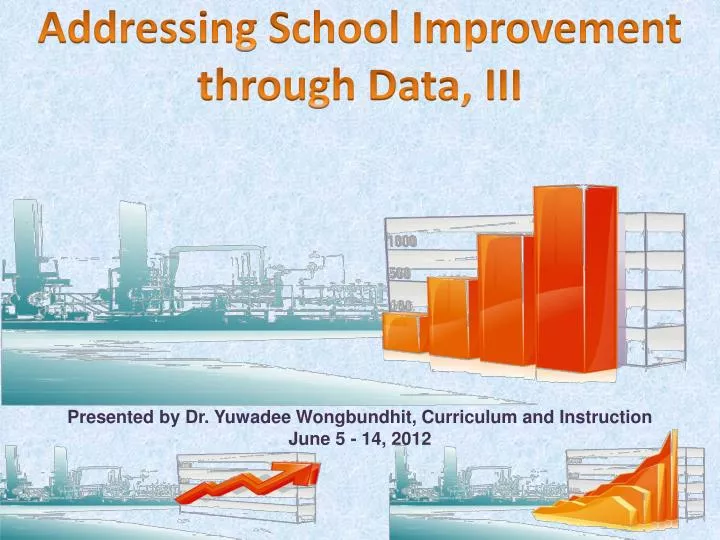
Addressing School Improvement through Data, III. Presented by Dr. Yuwadee Wongbundhit, Curriculum and Instruction June 5 - 14, 2012. Topics. Independent work: a draft copy of the complete School Improvement by June 22, 2012. Assumptions:. You. NORMS. Http://osi.dadeschools.net/actiondata .

E N D
Addressing School Improvement through Data, III Presented by Dr. Yuwadee Wongbundhit, Curriculum and Instruction June 5 - 14, 2012
Topics Independent work: a draft copy of the complete School Improvement by June 22, 2012
Assumptions: You...
2012-13 SIP Part II: Expected Improvements
AMO Performance Targets: 2010-11 to 2016-17 The goal of AMO-2 is to reduce the % of non-proficient by 50% over six years (2010-11 to 2016-17). • 70% 50% of 70 = 35 35÷6 = 5.83
AMO Performance Targets: 2010-11 to 2016-17 The goal of AMO-2 is to reduce the % of non-proficient by 50% over six years (2010-11 to 2016-17). • 40% 50% of 40 = 20 20÷6 = 3.33
Sample of AMO-2 Report Not Making Satisfactory Progress X X X X X X X
AMO-2 vs. Safe Harbor AMO-2 Targets Safe Harbor Targets
AMO-2 Targets vs. Safe Harbor Provision Targets Y Y N N N N N N Y N N N Y N
2012-13 Expected Level of Performance 12*.7=8.4 45+8.4=53 12*.3=3.6 10+3.6=14 55 67-55=12 67
SIP Goals for Reading/Math/Science 45+8.4=53 10+3.6=14
2012-13 Expected Level of Performance 3*.7=2.1 37+2.1=39 3*.3=0.9 27+0.9=28 64 67-64=3 67
SIP Goals for Reading/Math/Science 37+2.1=39 27+0.9=28
Worksheet 2: SIP Goals 1 and 2 5*.7=3.5 27+3.5=30.5 5*.3=1.5 25+1.5=26.5 52 57-52=5 57
2012-13 SIP Goals 1 and 2: Reading, Math, Science, and Algebra Goals
2012-13 SIP Goal 5 %: Reading and Math by Subgroup 2012-13 SIP Goals for geometry and biology, the 2012-13 Baseline results will be used the set for Expected level of performance.
If all data are available, the 2012-2013 Expected Improvement Chart with the individual school data be populated, along with the criteria to be used for determining the 2013 expected improvement.
2012-2013 School Improvement Plan Current and Expected Level of Performance Writing Attendance U.S History/ Civics Suspension Math/EOC Reading Dropout Prevention Science/Biology Graduation
Take a 10 minutes break Please be back on time Thank you!
FCAT 2.0/EOC Achievement Level Policy Definitions FCAT FCAT 2.0 and EOC