Download
1 / 23
250 likes | 550 Views
Inflation. Economists have different ideas about what causes inflation… Quantity (aka monetary) theory MV=PQ Demand-pull theory Cost-push theory Most economists believe that a steady inflation rate of 1-2% is ideal…. Negative effects of inflation

E N D
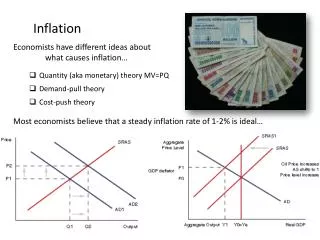
Inflation • Economists have different ideas about what causes inflation… • Quantity (aka monetary) theory MV=PQ • Demand-pull theory • Cost-push theory • Most economists believe that a steady inflation rate of 1-2% is ideal…
Negative effects of inflation • Transfer of wealth from savers to borrowers • Disincentives to save • Loss of purchasing power for those on fixed income • Business uncertainty • Loss of international competitiveness • Labor unrest
Demand-pull inflation: Occurs when there is an increase in total demand for a nation’s output, either from domestic households, foreign consumers, the government or firms (C, Xn, G or I). When demand increases without a corresponding increase in aggregate supply, the nation’s output cannot keep up with the demand, and prices are driven up as goods become more scarce. Cost-push inflation: Occurs as the result of a negative supply shock, arising from a sudden, often unanticipated, increase in the costs of production for the nation’s producers. Cost-push inflation could result from any of the following: LRAS LRAS SRAS2 SRAS PL PL SRAS1 P3 P2 AD3 Pfe Pfe AD1 AD Demand-pull inflation: When AD increases beyond the full-employment level of output the economy experiences an increase in the average price level Cost-push inflation: When AS decreases from the full-employment level, there is an increase in the average price level. Inflationary Gap Y2 Yfe Yfe Y3 real GDP real GDP
Degrees of inflation ‘Price level stability’ is a primary macroeconomic objective; but what is considered ‘stable’ inflation? Is NO inflation (0%) desirable? What about negative inflation? We must distinguish between different degrees of inflation to know what is a desirable inflation rate.
Consequences of Inflation High inflation, like high unemployment, has several negative effects on households, firms and the overall economy.
The Meaning of Inflation An increase in the average price level of goods and services of a nation over time What is in and out of the CPI basket and What is inflation?
Calculating the Inflation Rate To calculate inflation between two years, we first must determine the CPIs for the two years in question. Assume the CPI is made up of just three goods, whose prices during two years are indicated in the table below. • Determining the CPI: Assume 2011 is the base year, and we want to calculate inflation between 2011 and 2012 • CPI for 2011 = • CPI for 2012 = • With the CPIs known, we can calculate the rate of inflation:
Using a Weighted Price Index to Calculate Inflation • Because not all the goods measured in a nation’s Consumer Price Index are equally important to the typical household, governments weight particular types of consumption more than other types. • For example, food and beverages make up approximately 15% of the typical household’s budget in a given year. But housing (either rental payments or mortgage payments) make up 40%. • In this example, housing prices should be weighted more heavily than food and beverages • Consider the table showing the prices of the three goods measured in a CPI in two years, including the weight given to each good based on the percentage of the typical consumer’s income spent on it. • ..\video and audio\The_Drawing_Board____The_Median_Consumer_Price_Index_(Median_CPI).mp4 • To establish a price index with 2009 as the base year, we must calculate the weighted price of the basket of goods for 2009. To do this, we multiply the average price of each good by its weight, expressed in hundredths. • 2009: • Banana = 2 x 0.25 = 0.5, plus • Haircut = 11 x 0.3 = 3.3, plus • Taxi ride = 8 x 0.45 = 3.6 • Price index for 2009 = 7.7 • 2010: • Banana = 1.5 x 0.25 = 0.375, plus • Haircut = 10 x 0.3 = 3, plus • Taxi ride = 12 x 0.45 = 5.4 • Price index for 2010 = 8.775
Consequences of Deflation Deflation, a decrease in the average price level, sounds like a good thing. But it is not, and in some circumstances can be worse for an economy than mild inflation. Here’s why…
Deflation There is good deflation and bad deflation Good deflation This comes about from the LRAS shifting Output will increase and price levels with fall This assumes that AD remains (ceteris paribus) This will also give a lower level of unemployment (derived demand for labour from the increased demand for goods and services Deflation – a persistent fall in the average price level in the economy usually measured with the CPI (Consumer Price Index)
Negative effects of deflation • Transfer of wealth from borrowers to savers • Incentives to save • Increase of purchasing power for those on fixed income • Business uncertainty • Loss of international competitiveness • Labor unrest
Deflation • Japan has a problem with deflation • Banks collapsed due to bad debts and bad investments in their own stock market • People built up precautionary savings in case they lost their jobs • This depressed consumption and AD • Interest rates were cut to 0.25% but it didn’t work • Consumer and business confidence crumbled with people and firms reluctant to spend • Don’t confuse deflation with a falling rate of inflation (this is called disinflation)
Deflation/Disinflation • From 1999 to 2000 the inflation rate rose from 1.2% to 1.6% • From 2000 to 2001 the inflation rate fell from 1.6% to 1.3% • the average level of prices rose but at a lower rate than the previous year – disinflation • In the next two years the inflation rate continued to fall (prices were still rising but by a smaller and smaller amount) • In 2004 the country started to experience deflation (the average level of prices fell by 0.5%) • From 2004 to 2005 the country was still in a period of deflation where average prices fell by 0.3%
Do you understand which period of time did Japan experience: • Inflation • Disinflation • deflation
Costs of Deflation • Although consumers may be pleased with falling prices there are many problems with deflation • Deflation is also a bit of an unknown so it is more difficult to deal with than inflation • Some economists argue that the costs of deflation are higher than inflation • Unemployment • If AD is low businesses may lay off workers • If prices fall consumers will put off purchasing • Firms will have to drop prices to encourage consumption • Consumers will again put of purchasing believing that prices will fall further (deferred consumption) • Consumer confidence drops further depressing AD • This is known as a deflationary spiral • Investment will also be put off
Costs of Deflation • Costs to debtors • Anyone who has taken a loan (including house buyers who have taken a mortgage) suffers from deflation because the value of their debt rises • If profits are low businesses will find it difficult to pay back loans • There may be many bankruptcies • This will make business confidence even worse Play Japan deflation video
The Phillips CurveA graph which shows the relationship between unemployment and inflation in the short-run: • At point A: Aggregate demand is very high (probably beyond full employment) since inflation is higher than desired and unemployment is very low. • At point B: AD has fallen to a level around full employment. Inflation is stable and unemployment is at a more natural rate of 3.5% • At point C: AD has fallen, and the economy is probably in a recession. Inflation is very low and unemployment is relatively high.
Rationale for the Phillips Curve Relationship Why do inflation and unemployment move in opposite directions in the short-run? It all has to do with the amount of available labor in the economy at different levels of aggregate demand. • When AD is weak: If AD intersects SRAS at a level of output below full employment… • Firms have cut back on output and reduced their prices to try to maintain sales during the period of weak demand. Inflation is therefore low. • As workers have been laid off by firms, the number of people who are unemployed grows. Unemployment is therefore high. • When AD is strong: If AD intersects SRAS at a level of output beyond full employment… • Firms have seen their sales grow and have begun raising their prices as a result. The nation’s output is becoming more and more scarce, and consumers are willing to pay more, leading to inflation. • In an effort to meet the growing demand for output, firms have begun hiring new workers, reducing the level of frictional and structural unemployment.
Supply Shocks in the Short-run Phillips Curve As we have shown, a shift in AD causes a movement along the short-run Phillips Curve. However, a shift in SRAS will cause a shift in the short-run Phillips Curve. As seen below, a negative supply shock causes both unemployment and inflation to rise. This is seen as a rightward shift of the Phillips Curve.
The Long-run Phillips Curve • In the long-run, you will recall, all wages and prices in an economy are flexible. • If there has been high unemployment, wages will fall in the long-run and employment and output will return to full-employment. • From short-run to long-run in the Phillips Curve: In the graph to the right, we can see… • From point A to B: AD has increased, causing higher inflation and lower unemployment in the short-run. However, in the long-run, the economy will move… • From point B to C: Because following the increase in AD, workers see their real wages fall and so eventually demand higher nominal wages. As they do so, firms reduce employment and raise prices, returning unemployment to its natural rate (NRU), now at a higher inflation rate.
The Long-run Phillips Curve • In the long-run, you will recall, all wages and prices in an economy are flexible. • If there has been deflation in the economy, workers will accept lower wages in the long-run and employment and output will return to the full-employment level. • From short-run to long-run in the Phillips Curve: In the graph to the right, we can see… • From point A to B: AD has decreased, causing lower inflation and higher unemployment. However, in the long run the economy will move… • From point B to C: Because following the decrease in AD, workers who became unemployed eventually began accepting lower wages, leading firms to increase output and employment back to the full employment level In the long-run, unemployment always returns to its Natural Rate, regardless of the level of inflation!