Download
1 / 47
470 likes | 568 Views
The SI System. The Metric System Basic Training. Introduction. The metric system is a group of units used to make any kind of measurement, such as length, temperature, time, or weight. Metric Units. Introduction.

E N D
The SI System The Metric SystemBasic Training
Introduction The metric system is a group of units used to make any kind of measurement, such as length, temperature, time, or weight.
Introduction Scientists everywhere make measurements in metric units, and so do all other people in most countries.
History of Metric System A group of French scientists created the metric system in the 1790's. Since then, the system has been revised several times.
History of Weights and Measures As you watch the movie write down 5 questions (with answers) that could be used for a test.
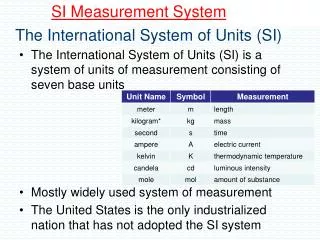
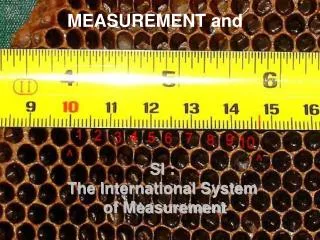
Introduction The official name of the present version is System International or (International System of Units), usually known simply as SI. The term metric comes from the base unit of length in the system, the meter.
The Creation of the Metric System In 1790, the National Assembly of France asked the French Academy of Sciences to create a standardsystem of weights and measures. Why do we need standards?
The Creation of the Metric System This system the French Academy of Sciences developed became known as the metric system, and France officially adopted it in 1795. But the government did not require the French people to use the new units of measurement until 1840.
The Creation of the Metric System The units for capacity and mass came from the meter. The commission chose the cubic decimeter as the unit of fluid capacity and named it the liter. A liter is a cube that is one decimeter on each side.
The Creation of the Metric System The scientists defined the unit for mass, the gram, as the mass of a cubic centimeter of water at the temperature where it weighs the most. That temperature is about 4 °C (39 °F).
Using the Metric System The metric system is simple to use for two reasons. First, it follows the decimal number system--that is, metric units increase or decrease in size by 10's.
Using the Metric System The metric system is a decimal system just as are the U.S. and Canadian money systems. In a decimal system, a unit is 10 times larger than the next smaller unit. For example, a meter equals 10 decimeters just as a dollar equals 10 dimes.
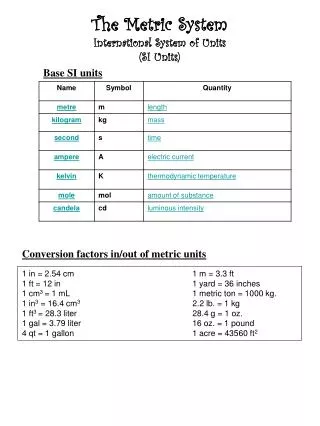
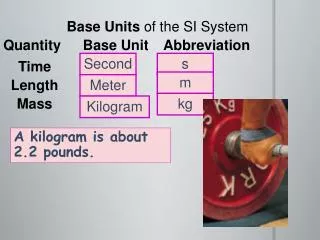
Metric Units of Measure • Seven base (basic) units form the foundation of the metric system. Nearly all everyday measurements involve only four of these units. • The meter is the base unit for length or distance. • (2) The kilogram is the base unit for mass, the weight of an object when measured on the earth. • (3) The second is the base unit for time. • (4) The kelvin is the base unit for temperature. Most people, when measuring in metric units, use Celsius temperatures instead of kelvin temperatures. One kelvin is equivalent to one degree Celsius, but the two temperature scales begin at different points.
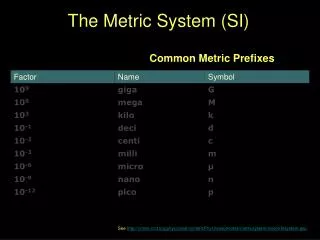
Metric Prefixes Most metric units have a prefix that tells the relationship of that unit to the base unit. These prefixes are the same no matter which base unit is used. This uniform system also simplifies metric measurement.
Metric Prefixes Greek prefixes are used to show multiples of a base unit. They make a base unit larger. For example, hecto means 100 times and kilo means 1,000 times.
Length and Distance The meter is used for such measurements as the length of a rope or of a piano or other large object. It also is used to measure the height of a mountain or the altitude of an airplane. A meter is slightly longer than a yard.
Length and Distance Short lengths are measured in centimeters, or they may be measured in millimeters. Books, pencils, and other small objects may be measured in centimeters. Photographic film, small hardware, and tiny mechanical parts are measured in millimeters.
Length and Distance Long distances, such as those between cities, are measured in kilometers. A kilometer equals about 5/8 of a mile. A short distance, such as that between two buildings on the same block, is measured in meters.
Volume and Capacity Volume and capacity measurements tell how much space something occupies or encloses. A volume measurement tells the size of a box, and a capacity measurement tells how much the box can hold.
Volume and Capacity Volume and capacity are both measured in cubic units, such as cubic meters or cubic decimeters. The volume of a box with each side 1 meter long equals 1 cubic meter. A cubic meter contains 1,000 cubic decimeters.
Volume and Capacity Most capacity measurements for liquids are made in units called liters. A liter equals a cubic decimeter and is slightly larger than a liquid quart.
Weight and Mass The mass of an object is not really the same as its weight because its weight changes with altitude. However, the two measurements are equal at sea level on the earth. The kilogram is a unit of mass. But most people who use the metric system think of the kilogram as a unit of weight.
Weight and Mass A kilogram is equal in mass to a liter of water. The amount is used to measure larger weights. The gram is used for small weight measurements. A gram equals 1/1,000 of a kilogram.
Weight and Mass For extremely small amounts, the milligram is used. The dose of an aspirin tablet and other medicines are measured in milligrams.
Temperature Most people who use the metric system have thermometers that are marked in degrees Celsius (°C). Water freezes at 0 °C and boils at 100 °C.
Temperature The normal body temperature of human beings is 37 °C. Celsius has been the official name of the metric scale for temperature since 1948.
Temperature Scientists do not know of any limit on how high a temperature may be. The temperature at the center of the sun is about 15,000,000 °C. However, nothing can have a temperature lower than –273°C. This temperature is called absolute zero. It forms the basis of the Kelvin scale used by some scientists. One degree Celsius equals one Kelvin. Because the Kelvin scale begins at absolute zero, 0 K equals –273°C, and 273 K equals 0 °C.
Volume (h) height (w) width (l) length
Volume V = lwh 5 cm 4 cm 8 cm
Volume V = lwh 5 cm V= 8 x 4 x 5 = 160 = 160 cm3 4 cm 8 cm
Graphing A Visual Display of Information or Data
Line Graph • Used to show trends. • Used to show how data changes over time. • Contains both independent and dependant variables. • Uses an x and y axis. • Adjacent points are related with a straight or curving line. (or we connect the dots)
The Y- Axis • The y-axis is the vertical (up & down) • The y-axis shows the dependent variable. • In this graph the dependent variable is money or sales Y A X I S Y
The Y- Axis • In this graph the dependent variable is money or sales • the dependent variable is the factor whose value changes because of a change in the independent variable. Y A X I S
The X- axis • The horizontal axis • This is the independent variable • This variable is changed by the experimenter to see what it does to the dependent variable. X x-axis
Intervals • When we are setting up a line graph, we need to decide what intervals we want to use. • If we are graphing the temperature for a year, do we want to put 365 days on the graph, and 100 different temperatures? • We always start our intervals at zero.
Now to Create a Line Graph • We will be creating a line graph with this data: • Looking at the room temperature over time. • Time is in minutes after turning on the heat.
Time (minutes) 0 5 10 15 20 25 Temperature (°F) 66° 67° 71° 73° 75° 76° The Data ( Time in independent variable- so it is the x axis-) (Dependent variable or the vertical y-axis is temperature)
Bar Graph • Useful for comparing information collected by counting. • The bars are not connected. • The height of bar corresponds to a particular number.
Circle Graph • Also know as a pie graph. • Shows how some fixed quantity is broken down into parts or percentages. • The slices of the pie represent percentages of the total.
Now Create a Graph • Here is the information: • A survey shows that in your neighborhood of 150 people:75 people ride the bus, 45 drive their own cars, 15 carpool, 9 walk, ride bikes or ride motorcycles and the rest use different methods on different days to get to work. • What kind of graph would be best for displaying this data? • A Bar or Pie graph would be best • Let’s create a bar graph of the data