Download
1 / 32
320 likes | 471 Views
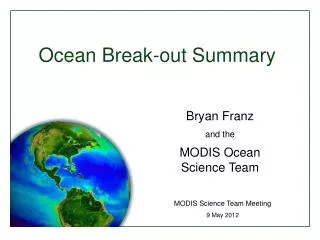
Summary of Ocean Break-out. Bryan Franz and the MODIS Ocean Science Team. MODIS Science Team Meeting 20 May 2011, College Park, MD. Senior Review Panel Question 6 for Terra:.

E N D
Summary of Ocean Break-out Bryan Franz and the MODIS Ocean Science Team MODIS Science Team Meeting 20 May 2011, College Park, MD
Senior Review Panel Question 6 for Terra: “Provide statistics/data on product use: What is the use of each product (quantitative comparison) and what is the use of products from each instrument?” Number of MODIS data granules distributed in 2010 by product type Number of MODIS data users in 2010 for each product type
L2P SSTs from the JPL PO-DAAC MODIS SSTs are the most requested L2P SST data sets at the NASA JPL PO-DAAC. Data from Ed Armstrong IGARSS 2009 Cape Town. July 16, 2009.
Ocean Science Team Members MODIS NPP/VIIRS Barney Balch Watson Gregg Peter Minnett Dave Siegel Kevin Turpie* Menghua Wang • Barney Balch • Peter Cornillon • Heidi Sosik (Hui Feng) • Bryan Franz* • Watson Gregg • Antonio Mannino • Stephane Maritorena • Galen McKinley (Colleen Mouw) • Peter Minnett • Norm Nelson • Crystal Thomas • Toby Westberry Additional Speakers • Chuck McClain • Sam Ahmed • Fred Patt • Zia Ahmad * Discipline Leads
Ocean Break-out Agenda May 18
Ocean Ecology Branch Organization Data Processing- Distribution SeaDAS Aquarius NPP Ocean PEATE (Code 610.2) Ocean Biology Processing Group Calibration & Validation SeaBASS 610.2: Global Change Data Center Field Support Group & HPLC Analysis Team Ocean Carbon Research & Laboratory Field & Satellite Sensor Development
NASA NPP SDS Level 1 Requirements • 2.1.2.1 The SDS shall be designed with the assumption that the operational IPO IDPS generated NPP EDRs do not require reprocessing or re-computation in order to support climate research needs. Consequently, the SDS will not be designed to routinely generate climate data products which require long-term archival in the ADS. • 2.1.2.3 In developing the SDS, the Project shall assume that EDRs produced by the IDPS are climate quality and put in place the capability to test that hypothesis in order to contribute to improving the quality of future EDRs. The SDS shall provide suggested algorithm improvements to the IDPS. The SDS is NOT tasked to produce data products for distribution. Fred Patt
NASA VIIRS Ocean Science Team • ▼Evaluate sensor artifacts (e.g, crosstalk) and potential corrections based on • Prelaunch: Characterization data and simulated data. • Postlaunch: Flight data and in situ data, if available. • ▶ Evaluate VIIRS RSB Rad Cal (solar, lunar, & vicarious). • ▶ Process VIIRS flight data with NASA algorithms to compare against operational products. • ▶ Sensor-to-sensor and self-consistency checks; will include in situ data, if available. • ▶ Expect to produce a postlaunch quality report after one year. RSB - Reflective Solar Bands Rad Cal - Radiometric Calibration Kevin Turpie
VIIRS DATA SIMULATOR • ▶ The VIIRS Data Simulator was designed to provide the ocean team with a better fidelity product for evaluating instrument effects to EDR quality. Key features: • Can generate global time series. • Ability to include sensor response and artifacts. • Helps to prepare team and infrastructure for postlaunch evaluation. Quasi-true color browse image showing global production by the VIIRS Data Sim-ulator for one day.
VIIRS DATA SIMULATOR • ▶ Based on MODIS Aqua L3: • L3 provides global surface fields. • VIIRS viewing geometry, w/ aggregation and bow-tie deletion. • l2gen atmospheric RT modeling provides TOA radiances. • VIIRS response and artifacts applied (see below). • Includes clouds and land radiances as well as ocean. • NASA algorithms used to produce “L2” VIIRS products. • ▶ Sensor artifacts currently included: • Spectral effects of optical crosstalk. • Spectral/spatial effects of electronic crosstalk. • VIIRS RSR, w/ OOB. • VIIRS polarization response. • VIIRS RVS. • ▶ Artifacts to be included shortly: • Noise (VIIRS SNR) • Stray light (NFR)
VIIRS OC Derived Chl a VIIRS DATA SIMULATOR ▶ L1, L2, & L3 simulated data will be available to science team members via restricted access to the oceancolor website. (L3 pending testing) ▶ Not operational yet, pending discussion with NPP Science Team members.
Ocean Break-out Agenda May 19
The NASA PIC algorithm has broadened our temporal view of global PIC • e.g. Global patterns of PIC standing stock • e.g. Will be important for evaluating global impacts of ocean acidification Merged 2-band/3-band algorithm for Particulate Inorganic Carbon (suspended calcium carbonate) The NASA PIC algorithm has broadened our spatial view of truly global PIC phenomena • e.g. The “Great Calcite Belt” • This high PIC feature has been validated • It covers 20% of global ocean Barney Balch
Expanded MODIS Product Suite NEW OLD Rrs(412) Rrs(443) Rrs(469) Rrs(488) Rrs(531) Rrs(547) Rrs(555) Rrs(645) Rrs(667) Rrs(678) • nLw(l) • Chlorophyll a • Kd(490) • Ångstrom • AOT • Epsilon • Rrs(l) • Chlorophyll a • Kd(490) • Ångstrom • AOT • POC • PIC • CDOM_index • PAR • iPAR • FLH land bands revised band center
2000 Colleen Mouw
Phytoplankton Biomass and Diversity on the New England Shelf: In Situ Time Series for Validation and Exploration of Remote Sensing AlgorithmsPI: Heidi M. Sosik, Woods Hole Oceanographic InstitutionCo-I: Hui Feng, University of New Hampshire Goal: Use unique time series to evaluate algorithms that extend MODIS ocean color data beyond chlorophyll to functional group or size-class-dependent phytoplankton retrievals Approach: End-to-end time series observations, with step by step algorithm evaluation and error analysis single cells phytoplankton community bulk water optical properties sea surface optical properties (air and water) MODIS optical properties Martha’s Vineyard Coastal Observatory Tower mounted AERONET-OC Submersible Imaging Flow Cytometry MODIS products
nLw: MODIS nLw: AERONET-OC • The study site presents important Opportunities and Challenges • Predictable seasonal switch in phytoplankton dominance • large diatoms in winter • small cells in summer • Phytoplankton community changes impact bulk optical properties ( (discrete samples) • Seasonality strong • Interannual variability also evident • MODIS products influenced by atmospheric correction and other potential issues • Well-known for northeast US waters • Unique dataset to evaluate new approaches
Scatterplot of Matchups in nLw spectra MODIS-Aqua Version 6 ( Reprocessing 2009 ) MODIS-Aqua Version 5
LISCO site Characteristics Platform: Collocated multispectral SeaPRISM and hyperspectral HyperSAS instrumentations since October 2009 LISCO Tower Instrument Panel Retractable Instrument Tower 12 meters MODIS 2011, Science Team Meeting Sam Ahmed
Satellite Validation Use of merged in situ data: Improve correlation and regression Reduce dispersion in comparison to the two datasets taken separately HyperSAS APD=23.6% SeaPRISM=23.7% Merged APD =18.1% (APD is driven by very low values, but the Absolute Diff. stays very low in respect to the radiometric resolution of the satellite) MODIS Rrs Collocated instruments permit data quality assurance Very high-quality data for calibration purposes MODIS 2011, Science Team Meeting
Satellite Validation Time Series of Water Remote Sensing Reflectance (Rrs) [sr-1] Consistency in seasonal variations observed from the platform and from space MODIS 2011, Science Team Meeting
Satellite Validation Aerosol Optical Thickness Validation 1:1 line AERONET Uncertainty Regression Line Strong Correlation and most of the matchup points are within the AERONET uncertainty for all satellite (best performance for MODIS-AQUA) Representativeness of LISCO site - suitable for aerosol retrieval MODIS 2011, Science Team Meeting
Comparison of τ(SeaWiFS vs. AERONET) Bermuda Wallops Island Scatter Plot Time Series • 81% of the retrieval at Bermuda and 78% of the retrievals at Wallops Island fall within an uncertainty of ±0.02 in τ
Comparison of α(SeaWiFS vs. AERONET) Bermuda Wallops Island • For new models, the Angstrom coeff. (α) shows better agreement over Bermuda than over Wallops Island • For old models, the α values are almost one-half of AERONET Values
Comparison of τ865 SeaWiFS vs. MODIS(atm) vs. MISR Pacific Ocean (40oN – 50oN) • τ865 from the SeaWiFS and MODIS sensors are very close (~ ±0.02) • The minimum values of τ865 from the MISR sensor are higher than SeaWiFS & MODIS values by ~ 0.05
M-AERI cruises Minnett – Sea Surface Temperature algorithm refinement and validation though ship-based infrared spectroradiometry Objective: Ensure that MODIS SSTs are part of the Climate Data Record Approach: • Use shipboard FTIR spectroradiometers (M-AERI), and filter radiometers (ISAR) for independent validation of MODIS SST retrievals. • Ensure traceability of validation data to NIST reference standards. • Continue studies into improved atmospheric correction algorithms. • Continue studies of thermal skin layer of the ocean. • Continue studies of diurnal heating and cooling in the upper ocean. • Related activities: • GHRSST Science Team • NPP (VIIRS) Science Team • SST Science Team • AATSR Science Advisory Group • HyspIRI Science Study Group • EUMETSAT Mission Expert Team
Topographic Control of Ocean Dynamics in the Subtropics(Peter Cornillon and Lew Rothstein) Objective: To better understand the topographic control of phenomena associated with the quasi-zonal structures observed in fields of mean dynamic ocean topography (Maximenko et al. (2008) and of sea surface temperature front probability (Obenour et al. (2010). Colored background is bathymetry in meters. White dots are locations where SST front probability exceeds 18% in 2004-2005. Purple and black lines are digitized bands of front probability to aid the eye and red lines are the approximate location of structures seen in fields of filtered mean dynamic topography.
MODIS/Terra gain corrections as a function of time at different view angles, based on SeaWIFS nLw 412 nm, Mirror 1 412 nm, Mirror 2 +10% -15% 2000 2012 Color coding: Frame/pixel 22 (beginning of scan, lunar),, 675 (nadir),, 989 (solar diffuser), 1250 (end of scan) 30 Gerhard Meister
Deep-Blue Aerosol Collaboration Jeong, M-J., N.C. Hsu, E.J. Kwiatkowska, B.A. Franz, G. Meister, C.E. Salustro (2011). Impacts of Cross-platform Vicarious Calibration on the Deep Blue Aerosol Retrievals for Moderate Resolution Imaging Spectroradiometer aboard Terra, T. Geo. Rem. Sens., accepted.