Download
1 / 27
270 likes | 434 Views
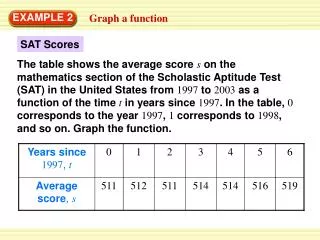
Aim: 1. How can we create a graph? 2. What is the purpose of a graph?. Do Now: Handout – Read introduction & write the definition for each vocabulary word. Homework: Have a Great Weekend!!!. Setting Up Line Graph. Create a title Each axis must be labeled & indicate units

E N D
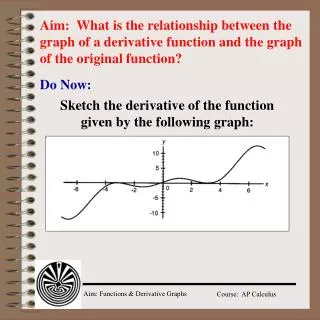
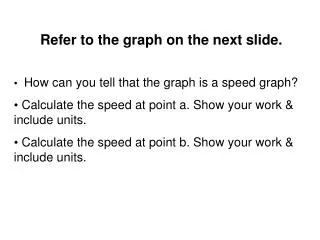
Aim: 1. How can we create a graph? 2. What is the purpose of a graph? Do Now: Handout – Read introduction & write the definition for each vocabulary word. Homework: Have a Great Weekend!!!
Setting Up Line Graph • Create a title • Each axis must be labeled & indicate units • Independent variable (the cause) is represented on the horizontal axis (X-axis) • Dependent variable (the effect or result) is represented on the vertical axis (Y-axis) • Numbers on each axis must be consistent (each box or line increases by same amount) • Points must be plotted in proper location, circled and connected
What is the purpose of a graph? • Graphs provide an organized way to display data • They provide an easier way to see patterns which may be used to make predictions
VOCABULARY: • Variable – a factor that can be changed (increase, decrease, or remain the same) • Relationship – association between 2 variables • Independent Variable – you change (causes a response) • Dependent Variable – is effected (responds to independent variable) • Direct Relationship – both variables change in the same way or direction (both increase or both decrease) • Inverse Relationship – variables change in different directions
Time in Shower Amt. of water used As the length of time in the shower increases, the amt. of water used increases Direct Size of Serving Amt. of Calories As the serving size increases, the amt. of calories taken in increases Direct
Calorie Intake Weight As calorie intake increases, a person’s weight also increases Direct Amt. of Exercise Weight As the amt. of exercise increases, a person’s weight decreases Inverse
# of students in classroom Temp. of classroom As the # of students in a classroom increases, The temp. of the classroom increases Direct Amt. of Exercise Heart Rate As the amt. of exercise increases, a person’s heart rate increases Direct # of students sharing a pizza pie Size of a slice of pizza As the # of students sharing a pizza pie increases, The size of a slice of pizza decreases Inverse
Amt. of completed homework Grades As the amt. of completed homework increases, your grades will also increase. Direct Carbon dioxide level in the blood Rate of breathing As carbon dioxide levels in the blood increase, Your breathing rate will increase. Direct
Date: 10/5/2007 Friday Aim: What is the relationship between the dependent & independent variables?(Interpreting Line Graphs Part B) Do Now: 1. Take out homework. 2. Handout Homework: Complete Part C (1-5) Study for next Thursday & Friday’s exam on Graphing & Density
A is heavier than B A is faster than B A is shorter than B A is younger than B B weighs less than A B is slower than A B is taller than A B is older than A
B weighs less than A A costs less than B A is smaller than B A weighs more than B B costs more than A B is larger than A A & B have the same temp.
A is warmer than B B has longer feet than A A is earlier than B B is less intelligent than A B is colder than A A has shorter feet than B B is later than A A is more intelligent than B
Aim: What are 4 types of line graphs? Do Now: 1. Take out homework. (Part C) 2. What is a cycle? Homework: Handout (Graphs: Multiple Choice 1-10)
Events that repeat themselves over & over again • Can be used to make predictions • Examples include: • Phases of the moon • Day & Night • Tides • Yearly cycles What is a cyclic event?
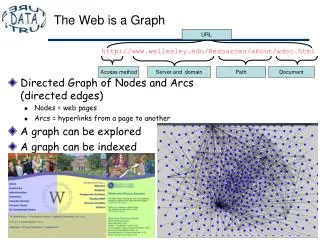
A. B. C. D. Temp Temp Temp Temp (ºC) (ºC) (ºC) (ºC) Time Time Time Time (Hour) (Hour) (Hour) (Hour) Relationship Relationship Relationship Relationship As time increases, Temp. Increases Then Decreases… As time increases, Temp. stays the same As time increases, Temp. decreases As time increases, Temp. increases Direct Relationship Inverse Relationship Cyclic Event
Example: If we have 4 different pieces of aluminum, each having a different volume, which graph shows the relationship between density & volume? D. A. B. C. Density Density Density Density (g/ml) (g/ml) (g/ml) (g/ml) Volume Volume Volume Volume (ml) (ml) (ml) (ml)
Aim: 1. How can we interpolate & extrapolate information from a graph? 2. Hand back Scientific Method & DMV Exam Do Now: 1. Take out homework. 2. What does extrapolate mean? Homework: Study for tomorrow’s Quiz on Graphs.
Extend the line of your graph using a straight edge (ex. ruler) • You can extend the line in both directions!!! How can we extrapolate information from our graph?
What is the mass of this object if the volume is 275 ml? What is the volume of this object if the mass is 400 g?
What is the mass of this object if the volume is 100 ml? What is the volume of this object if the mass is 300 g?
Aim: Review: What do you know about graphing & density? Do Now: Prepare for Graphing Quiz. Homework: Study for next Tuesday & Wednesday’s Graphing Exam
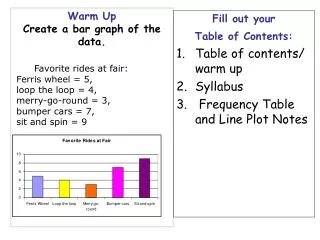
Graphing Quiz: • Two variables that change in different directions (one increases & one decreases) describes a ____________ relationship. • Identify the Dependent Variable for the following: Heart Rate/Amount of Exercise: • 3. Label the following graph with the above variables: • 4. Write down the type of relationship. (Inverse or Direct) • 5. Draw the shape of the line on the graph. • ( or )
6. & 7. Write two statements describing point A’s relationship to point B. Weight A B Height
Using your graph handout from yesterday answer questions 8 & 9: • What is the mass of the object if the volume = 125mL? • What is volume of the object if the mass = 350 g? 10. Describe what the word “extrapolation” means.
Match the Following Densities to the Picture: A. 1.0 g/cm3 B. 2.0 g/cm3 C. 0.7 g/cm3 D E C D. 0.2 g/cm3 A E. 0.5 g/cm3 B
Aim: Exam: What do you know about graphing & density? Part II Do Now: Take out Pencil & Calculator & put up binders Homework: Study for Tomorrow’s exam on Graphing & Density – Part I ***Bring a #2 pencil & calculator
Date: 10/12/2007 Friday Aim: 1. Exam: What do you know about graphing & density? Part I 2. Are you in motion? Do Now: Take out Pencil & Calculator & put up binders Homework: Have a good weekend!!!